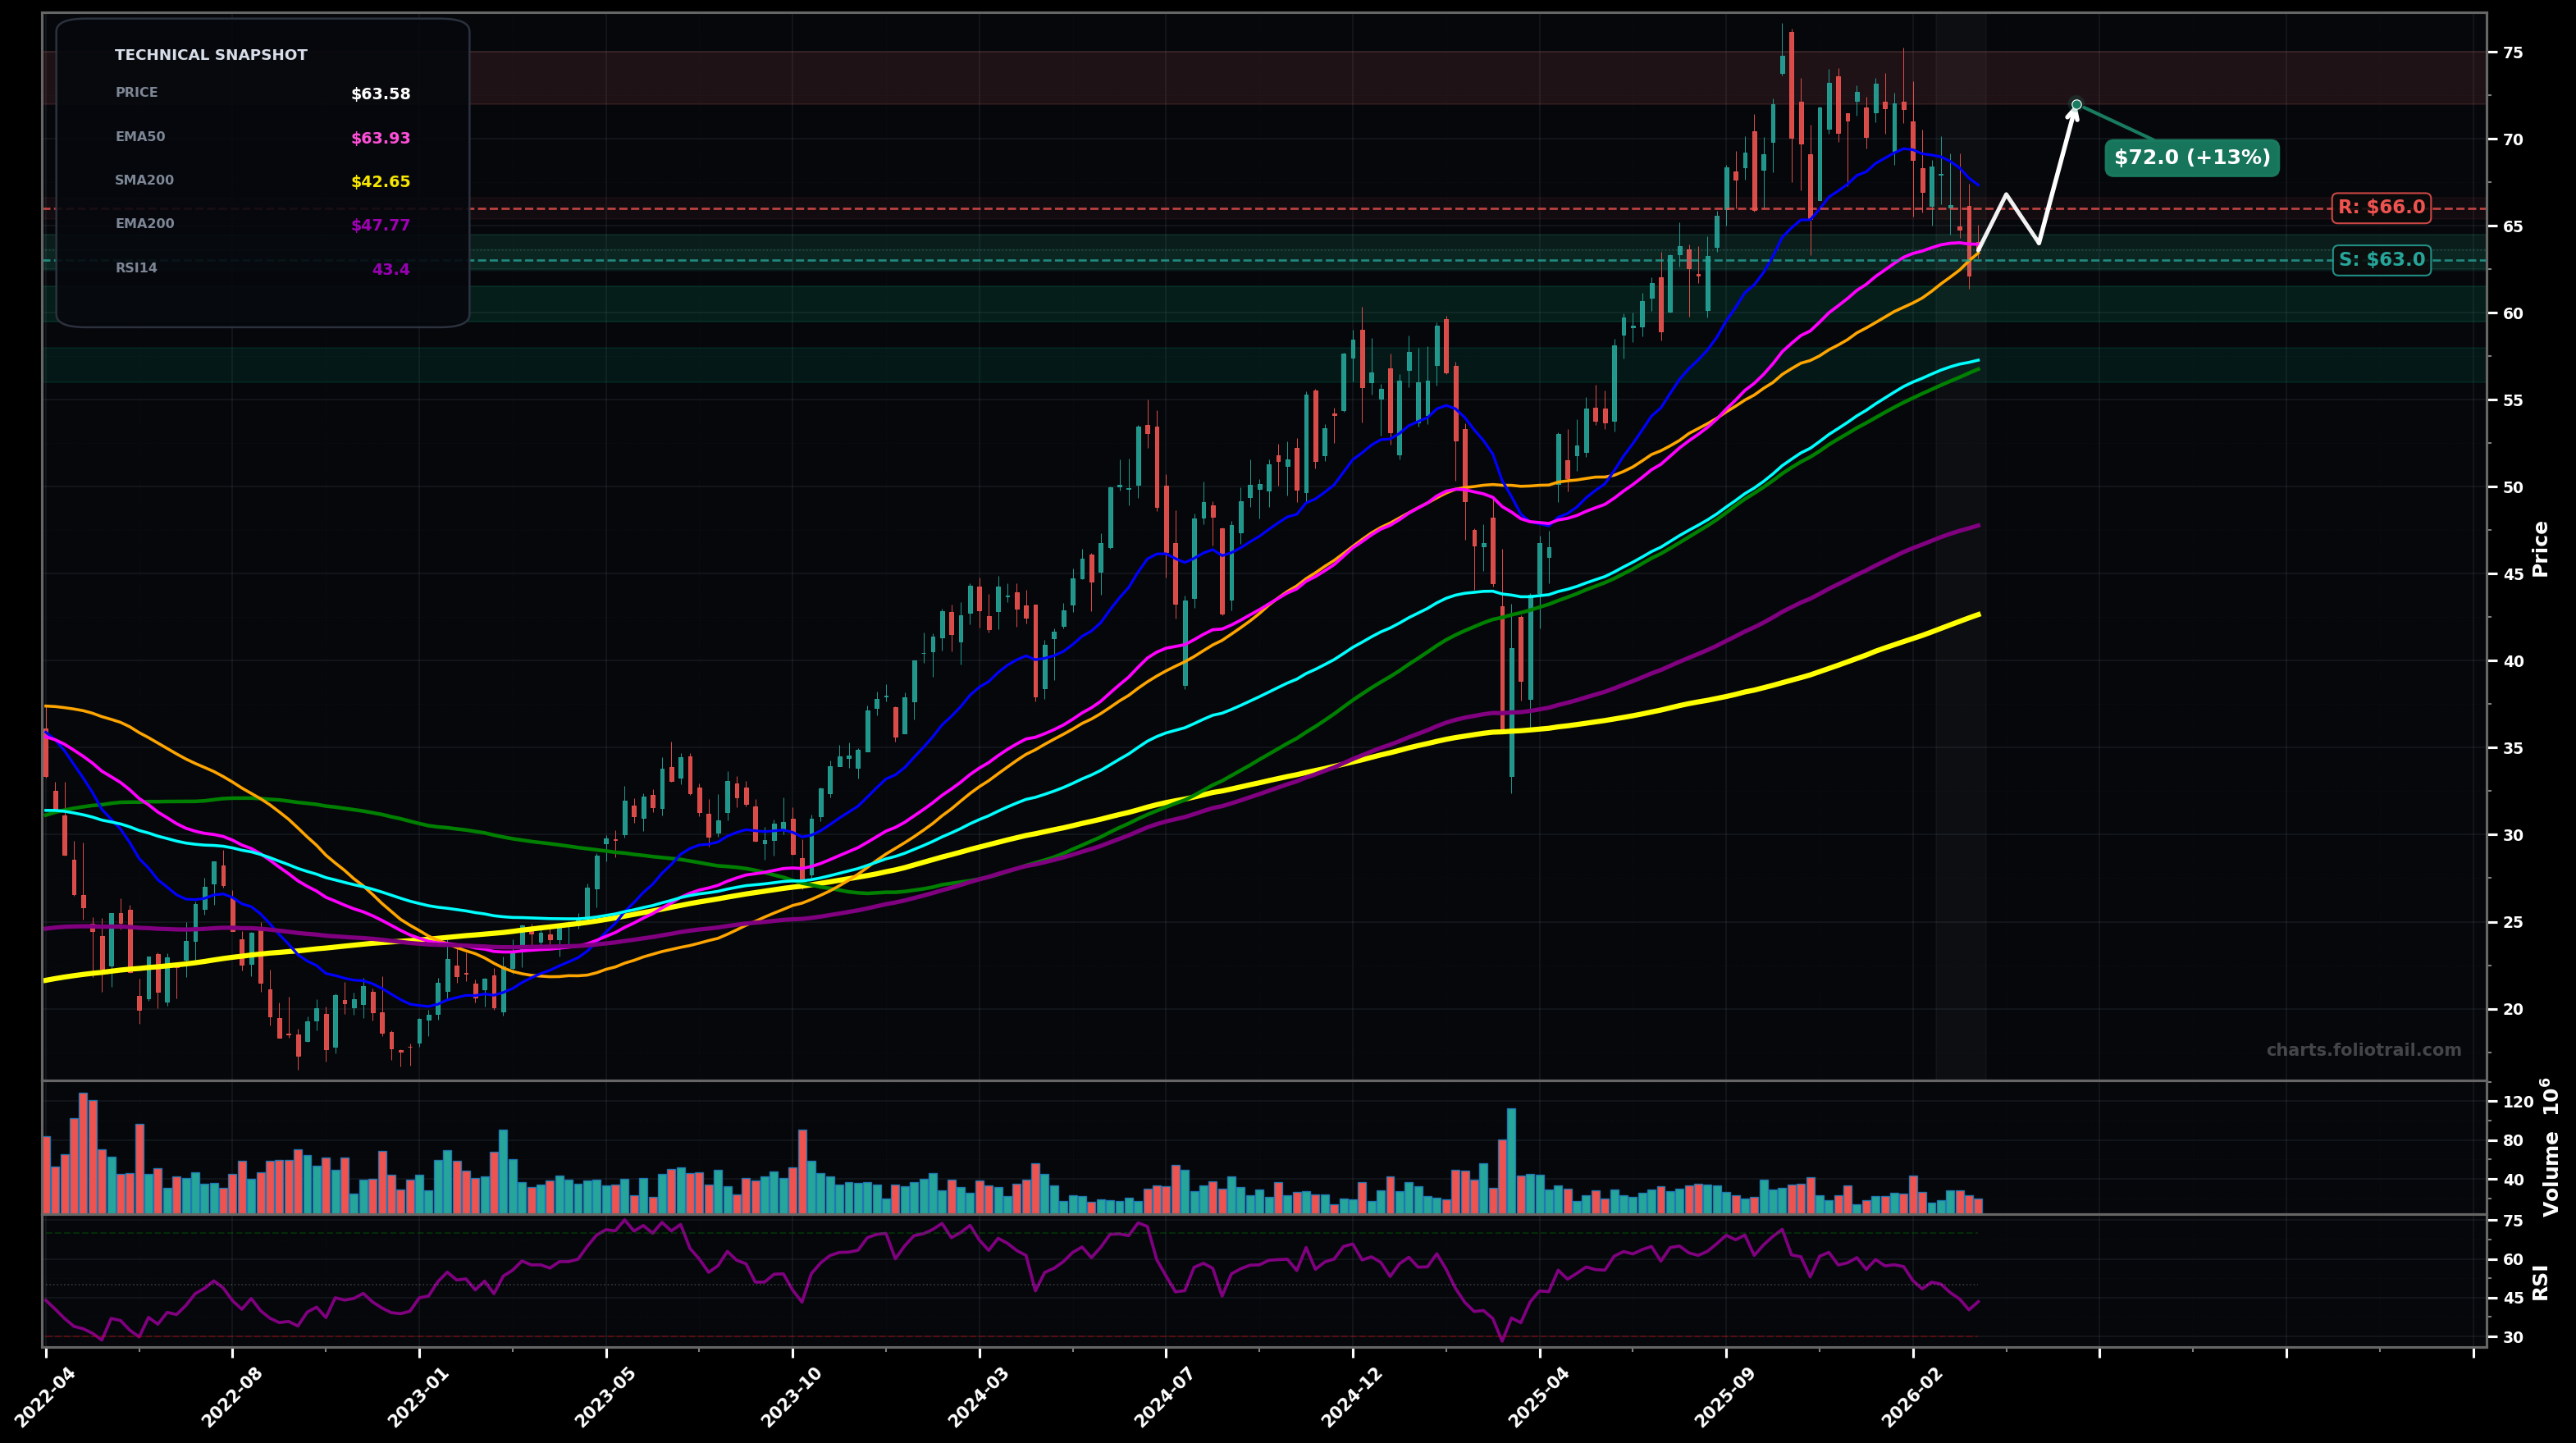
As of March 24, 2026, QLD (ProShares Ultra QQQ) is in a bottoming attempt state on the weekly chart, with a confidence level of 58%. Key support is at $63.0 and key resistance at $66.0. Weekly pullback from the ~$74-$75 peak; price (~$63.58) is sitting on the EMA50 (pink) and just under the SMA50 (orange) with RSI14 ~43 (momentum cooling).
Corrective pullback completes near EMA50, then a bounce/grind higher toward the prior breakdown zone; if that is reclaimed, a retest of the highs becomes likely (Elliott: this looks like a Wave 4-type correction inside a larger uptrend).
Deeper correction: lose EMA50 support and mean-revert to the EMA100/SMA100 confluence (typical 38.2%–50% style retrace of the prior impulse), before attempting a larger base.
Confirm if QLD reclaims and holds above $66.00 for 2+ weekly closes (back above the 20W area / short-term trendline).
Invalidate if a weekly close below $62.50 occurs (clean break under EMA50/pivot support).
Start near EMA50/pivot support; add on a controlled flush toward EMA100/SMA100; heavy add near the EMA100 (~$57) where a Wave-4 correction often terminates if the larger trend remains intact.
Trim into prior high/overhead supply first; larger trims if price becomes extended well above rising medium/long MAs; close if a multi-year-style extension/run-up develops far above the MA stack.
As of March 24, 2026, QLD (ProShares Ultra QQQ) is in a bottoming attempt state on the weekly chart with 58% confidence. Weekly pullback from the ~$74-$75 peak; price (~$63.58) is sitting on the EMA50 (pink) and just under the SMA50 (orange) with RSI14 ~43 (momentum cooling).
On the weekly timeframe, QLD has key support at $63.0 and key resistance at $66.0. The most likely scenario (bullish) targets $66.8 and $72.0, with a revert level at $64.0.
QLD (ProShares Ultra QQQ) is currently classified as bottoming attempt on the weekly chart, with 58% confidence. Confirmation requires: Confirm if QLD reclaims and holds above $66.00 for 2+ weekly closes (back above the 20W area / short-term trendline). This would be invalidated by: Invalidate if a weekly close below $62.50 occurs (clean break under EMA50/pivot support).
The most likely scenario (bullish) targets $66.8 and $72.0, with a revert level at $64.0. The alternative scenario (bearish) targets $60.0 and $57.2.
All content on this website — including charts, analysis, price targets, support/resistance levels, and position zones — is generated entirely by AI and provided for educational and informational purposes only.
This is not financial advice. NEXUSNOIR VENTURES SL (the operator of this website) is not a registered investment adviser or broker-dealer. You should not make investment decisions based solely on this information. Always do your own research and consult a qualified financial advisor.
By continuing, you acknowledge that you have read and agree to our full disclaimer & terms of use and privacy policy.