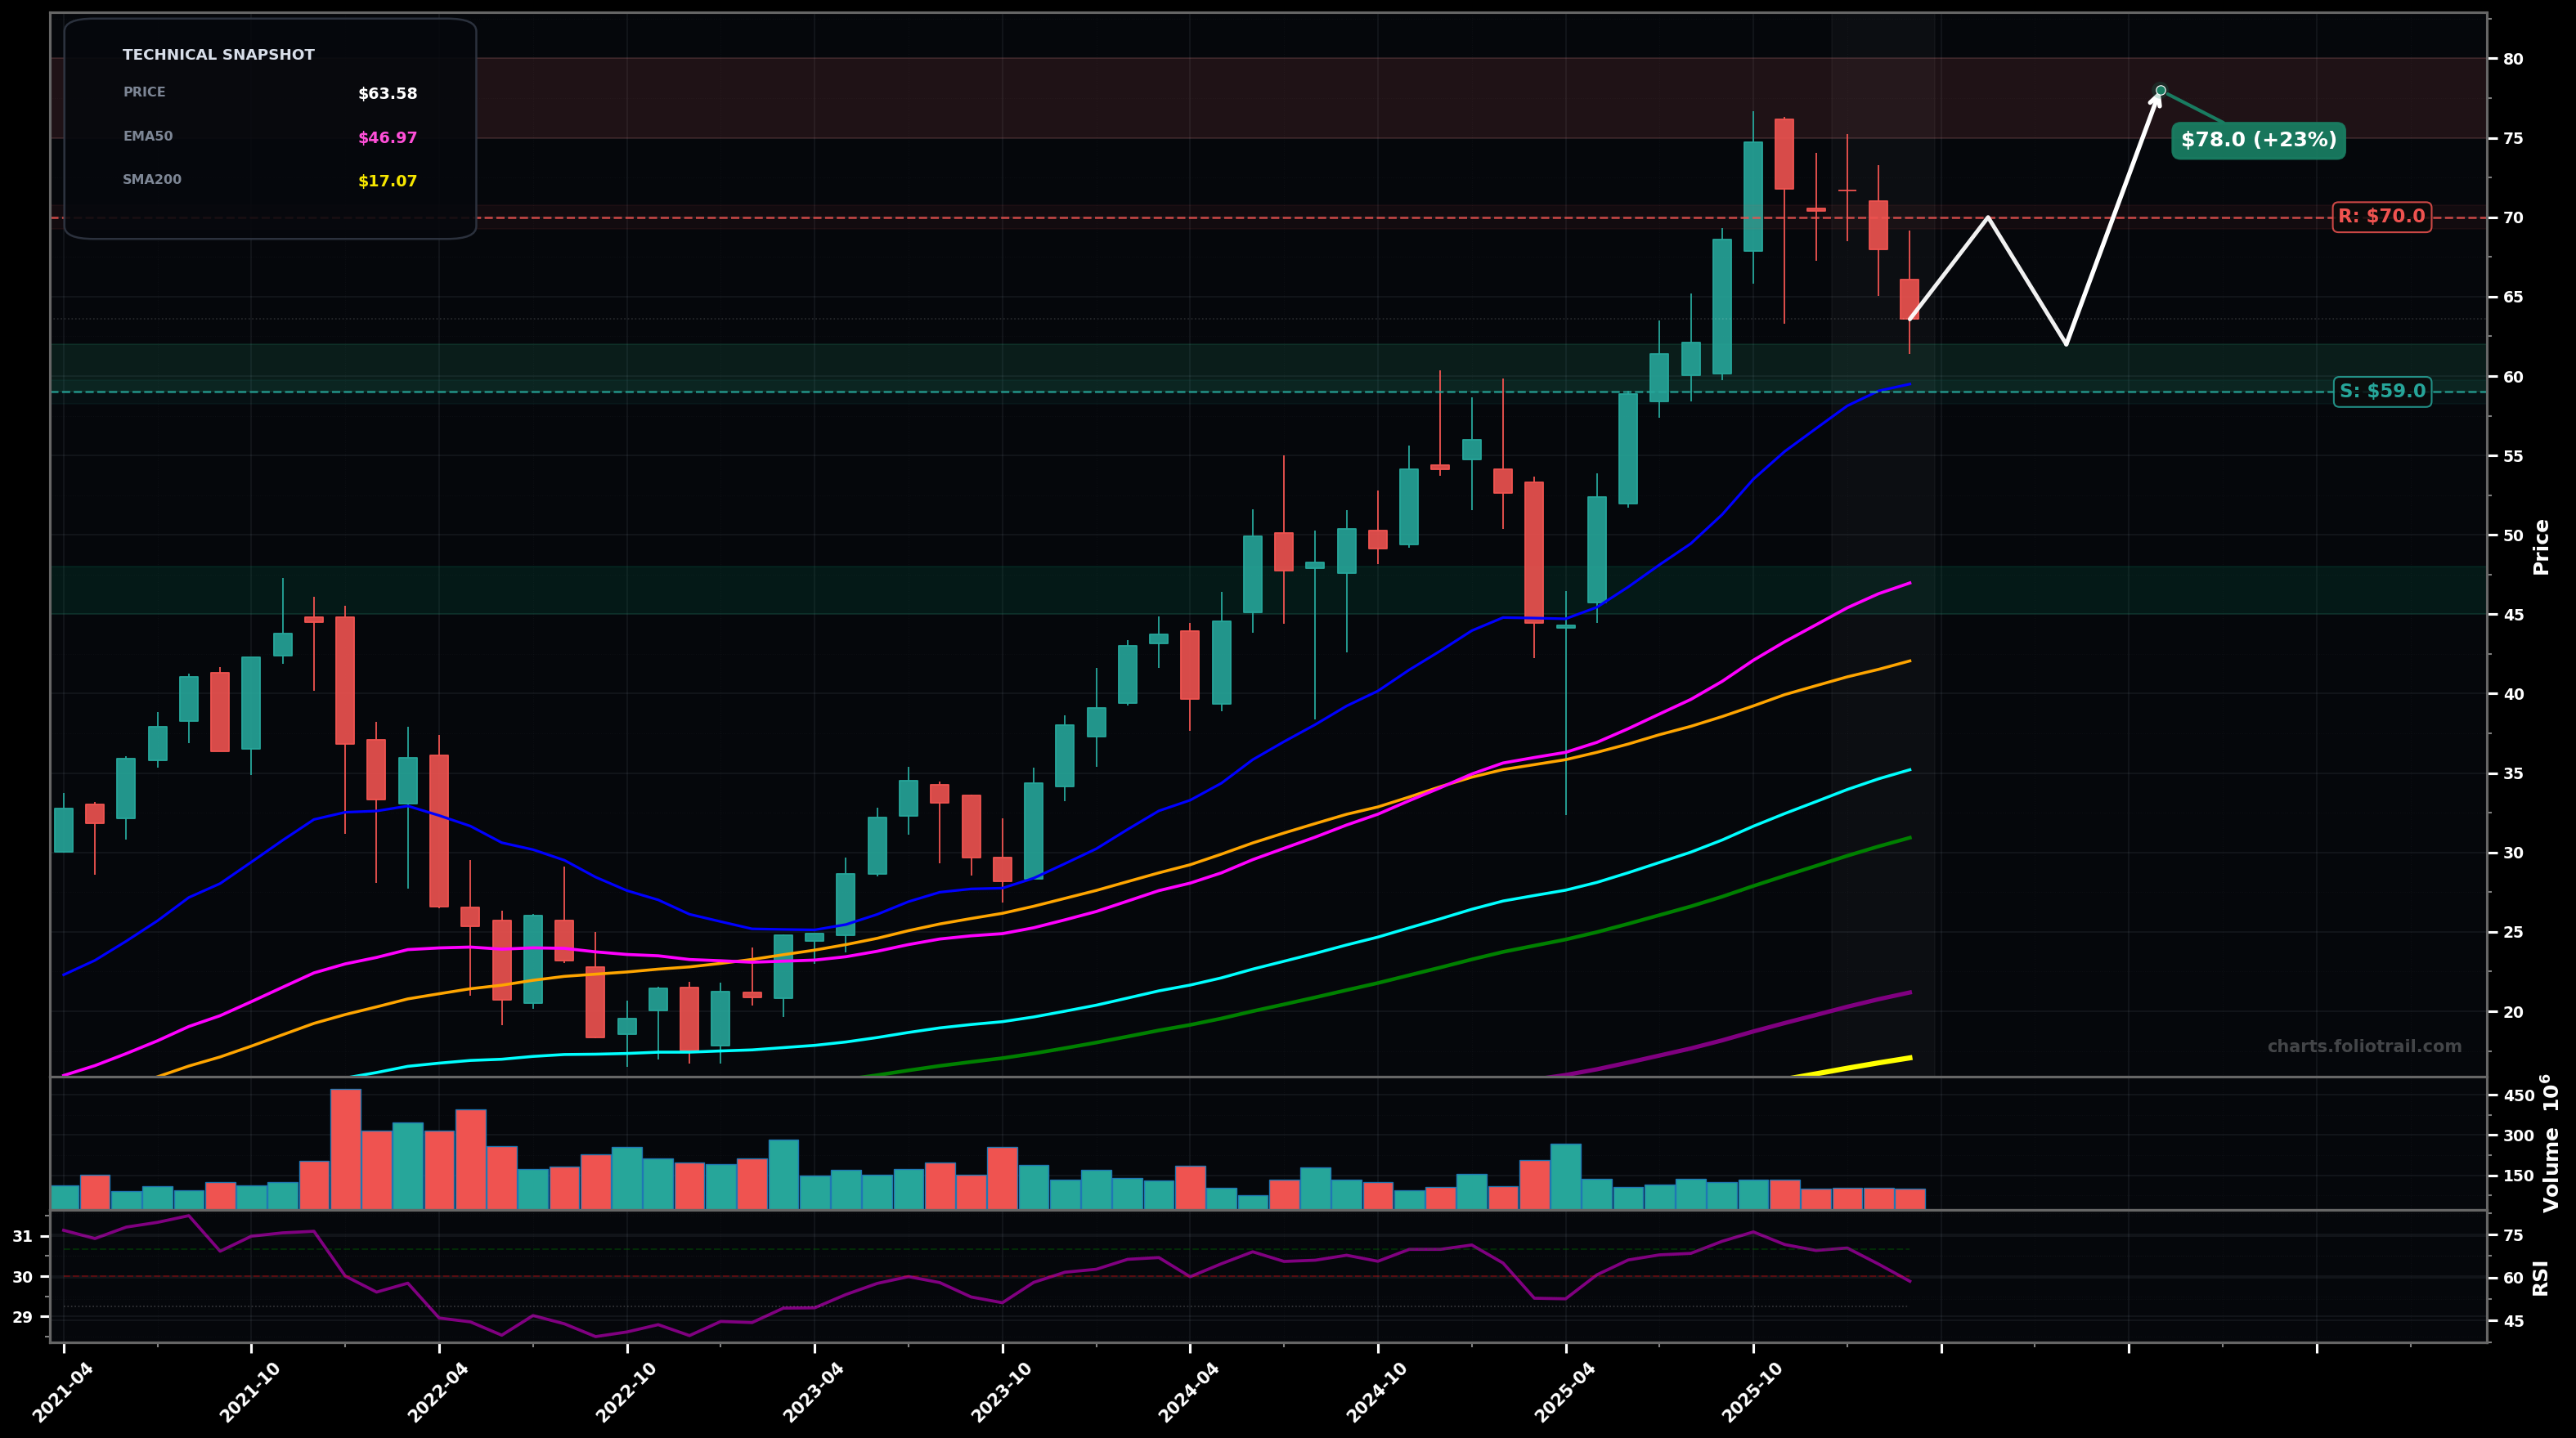
As of March 24, 2026, QLD (ProShares Ultra QQQ) is in a uptrend state on the monthly chart, with a confidence level of 63%. Key support is at $59.0 and key resistance at $70.0. Monthly pullback from ~$75 swing high to ~$63.58; candles printing LH sequence after a strong impulse run; still holding above rising EMA50/EMA100.
Base/flag-type correction completes above the $59–$60 swing-low area, then trend resumes (Elliott: likely wave 4 consolidation before wave 5 attempt). Fibonacci: a typical wave-4 pullback often holds between the 23.6%–38.2% retrace of the prior impulse, aligning with the current dip zone.
Correction deepens into a larger A-B-C: break below $59 triggers a move toward the rising EMA50 region; momentum cools and a multi-month reset forms before any new highs (Fibonacci: 38.2%–50% retrace of the 2023–2025 advance is plausible).
Close back above $70 (monthly) to reassert continuation and regain upside momentum.
Monthly close below $59 would signal deeper correction risk and threaten the prior swing-low reference.
Start near swing-low support; add on confirmed deeper fib/structure retrace; heavy add near rising EMA50 (pink) confluence and prior breakout area if trend structure still intact.
Trim into extensions above prior ATH where wave-5/late-cycle behavior is typical; more trimming on strong vertical acceleration; close if price becomes far stretched vs EMA50/EMA100 with blow-off characteristics.
As of March 24, 2026, QLD (ProShares Ultra QQQ) is in a uptrend state on the monthly chart with 63% confidence. Monthly pullback from ~$75 swing high to ~$63.58; candles printing LH sequence after a strong impulse run; still holding above rising EMA50/EMA100.
On the monthly timeframe, QLD has key support at $59.0 and key resistance at $70.0. The most likely scenario (bullish) targets $70.0 and $78.0, with a revert level at $62.0.
QLD (ProShares Ultra QQQ) is currently classified as uptrend on the monthly chart, with 63% confidence. Confirmation requires: Close back above $70 (monthly) to reassert continuation and regain upside momentum. This would be invalidated by: Monthly close below $59 would signal deeper correction risk and threaten the prior swing-low reference.
The most likely scenario (bullish) targets $70.0 and $78.0, with a revert level at $62.0. The alternative scenario (bearish) targets $55.0 and $47.0.
All content on this website — including charts, analysis, price targets, support/resistance levels, and position zones — is generated entirely by AI and provided for educational and informational purposes only.
This is not financial advice. NEXUSNOIR VENTURES SL (the operator of this website) is not a registered investment adviser or broker-dealer. You should not make investment decisions based solely on this information. Always do your own research and consult a qualified financial advisor.
By continuing, you acknowledge that you have read and agree to our full disclaimer & terms of use and privacy policy.