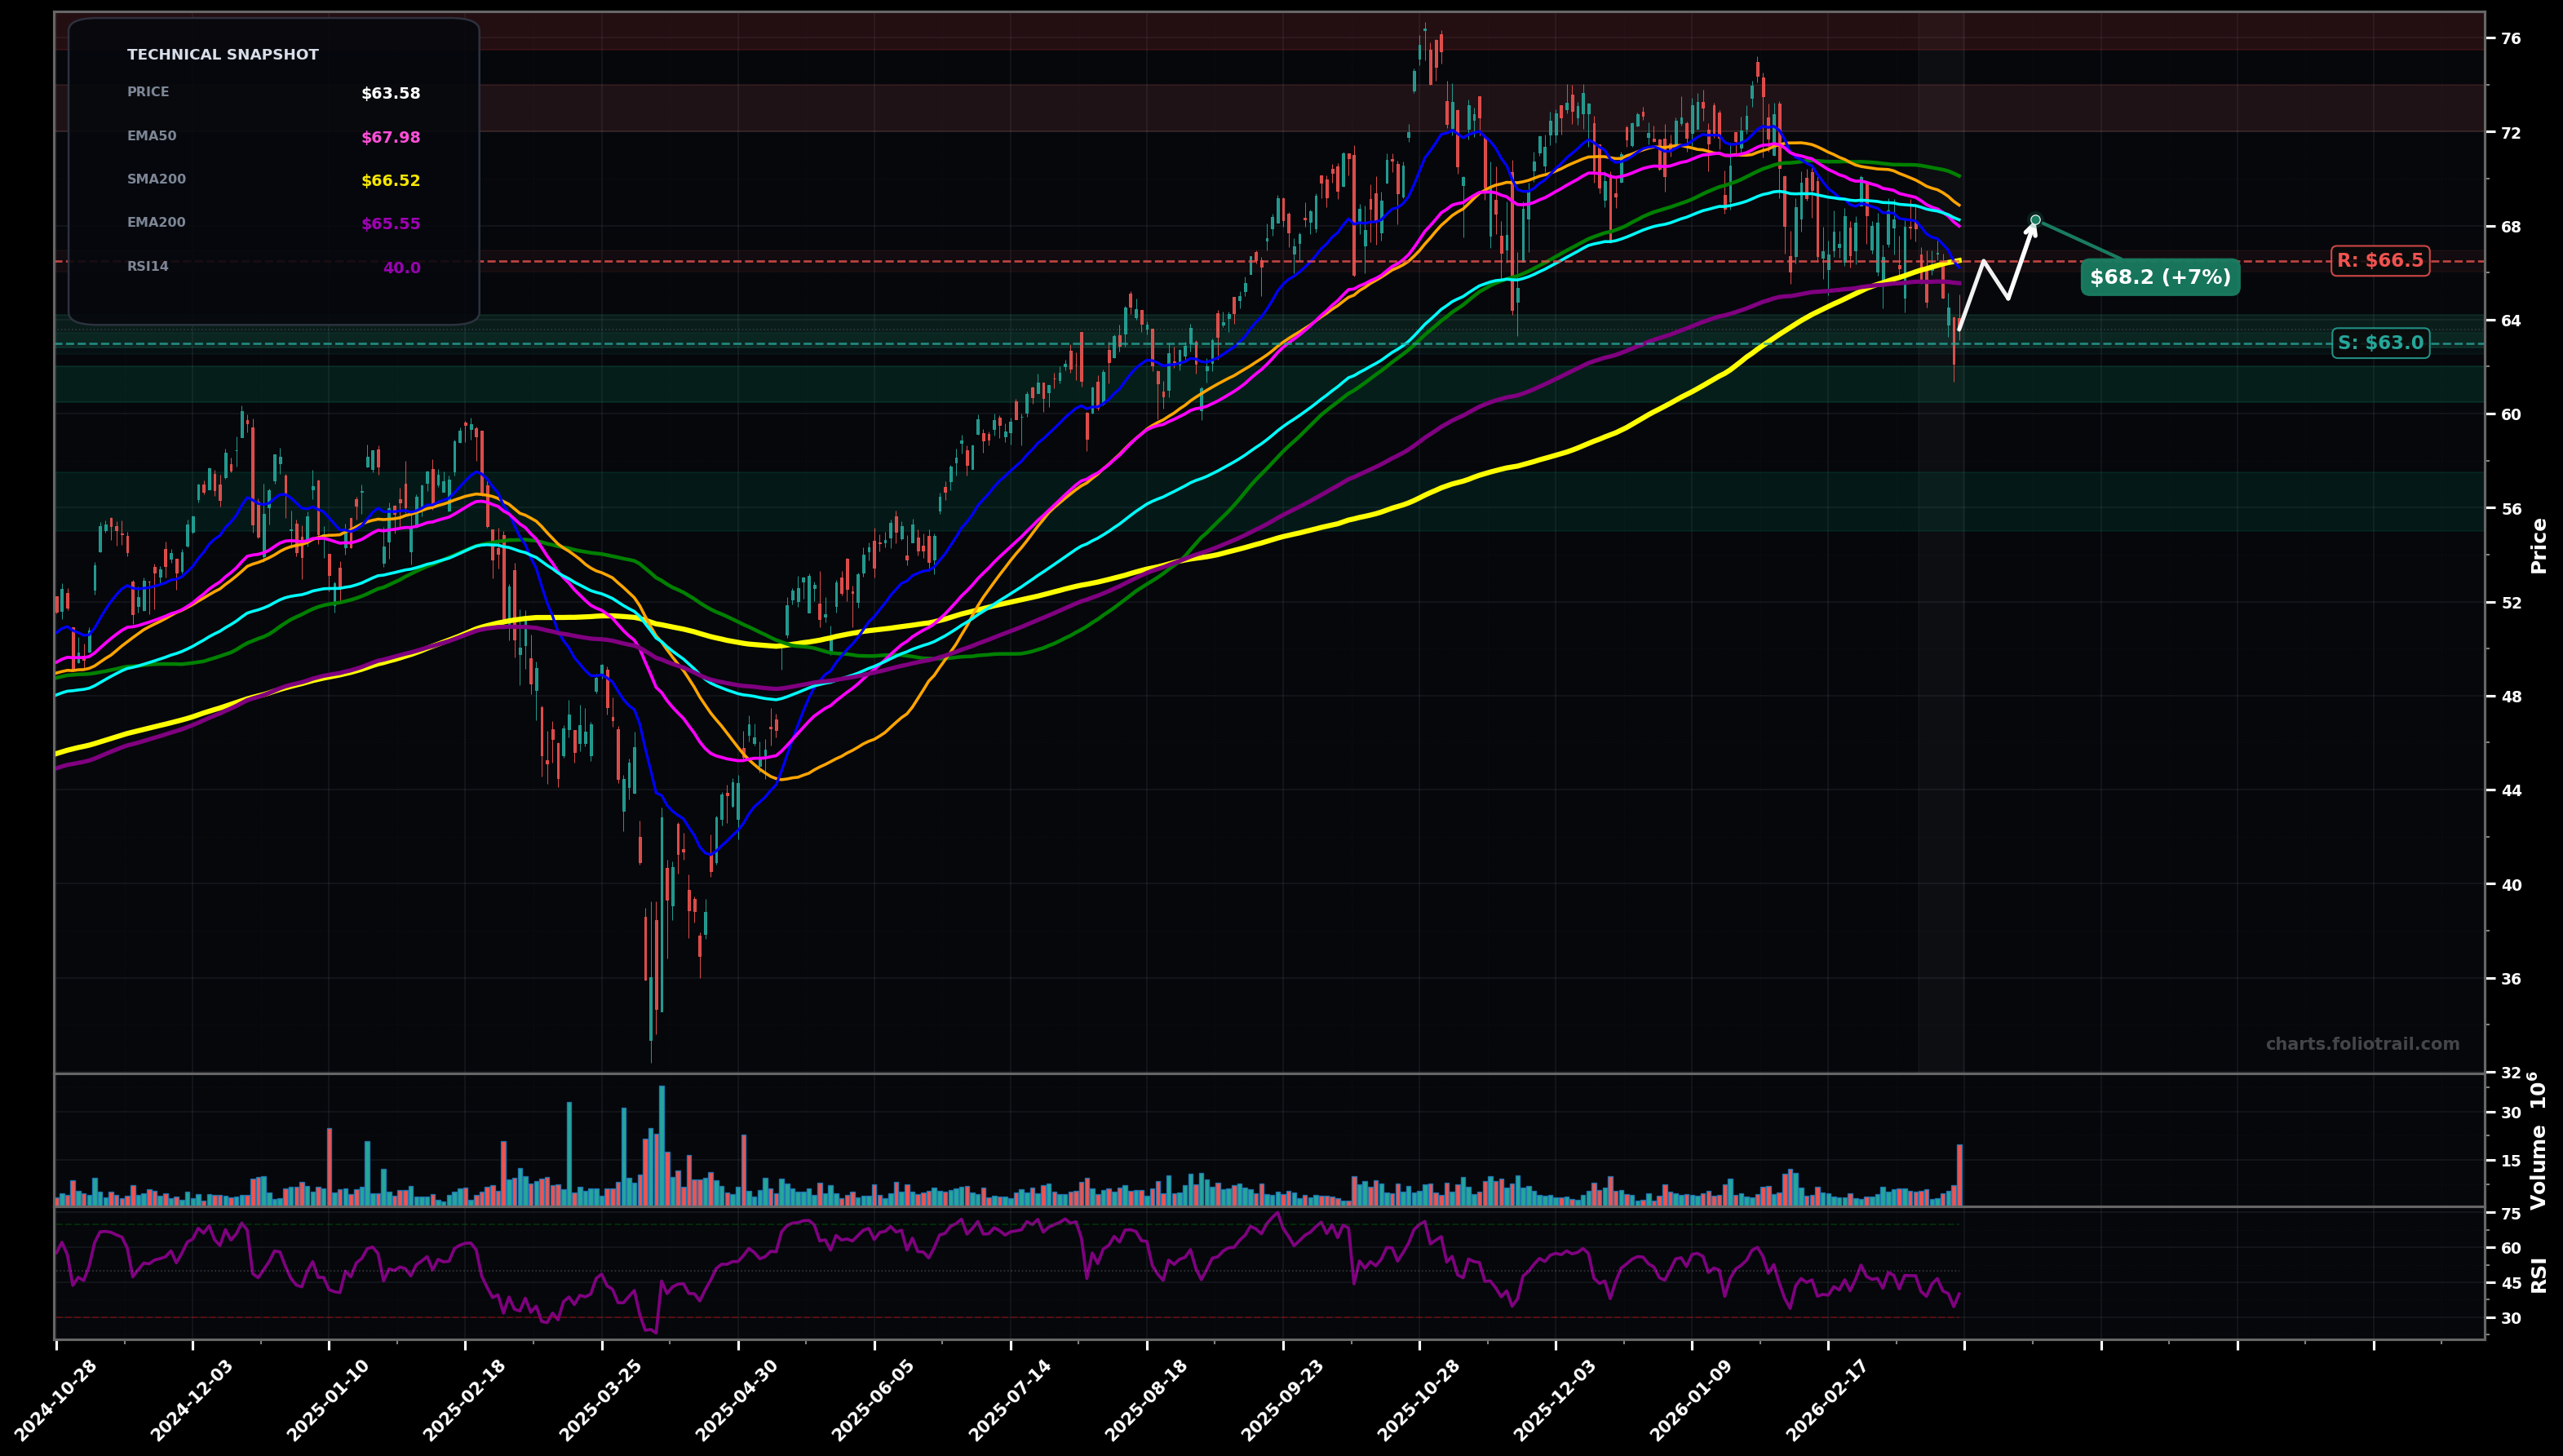
As of March 24, 2026, QLD (ProShares Ultra QQQ) is in a bottoming attempt state on the daily chart, with a confidence level of 58%. Key support is at $63.0 and key resistance at $66.5. Sharp selloff to $63.58 with a large red close near lows, breaking below the clustered fast MAs and slipping under the rising SMA200/EMA200 area.
Mean-reversion bounce from the $63-$64 demand zone with a retest of the long-term MA cluster, then attempt to reclaim EMA50/EMA100; this aligns with an Elliott Wave view of a corrective leg finishing (wave C) and starting a new counter-trend wave 1 up.
Continuation lower after a weak bounce (bear flag): price fails at the $66-$67 band and rolls into a deeper fib retracement of the prior uptrend (from the ~$33 low to the ~$76 high), targeting the ~50%-61.8% region.
Two daily closes back above $68.25 (EMA100) while holding above $66.50 on pullbacks
Daily close below $62.80 (loss of the latest swing-low zone and no immediate reclaim)
Start near current swing-low/support; add if breakdown extends to prior demand/fib mid-retrace; heavy add into deeper 50%-61.8% retrace zone where reversals often form if the long-term uptrend remains intact.
Trim into prior supply near the old highs ($75-$76) and above; fully exit only if a strong extension/overstretch occurs well above prior ATH where risk of a larger Elliott Wave top (wave 5 blow-off) rises.
As of March 24, 2026, QLD (ProShares Ultra QQQ) is in a bottoming attempt state on the daily chart with 58% confidence. Sharp selloff to $63.58 with a large red close near lows, breaking below the clustered fast MAs and slipping under the rising SMA200/EMA200 area.
On the daily timeframe, QLD has key support at $63.0 and key resistance at $66.5. The most likely scenario (bullish) targets $66.5 and $68.2, with a revert level at $64.9.
QLD (ProShares Ultra QQQ) is currently classified as bottoming attempt on the daily chart, with 58% confidence. Confirmation requires: Two daily closes back above $68.25 (EMA100) while holding above $66.50 on pullbacks This would be invalidated by: Daily close below $62.80 (loss of the latest swing-low zone and no immediate reclaim)
The most likely scenario (bullish) targets $66.5 and $68.2, with a revert level at $64.9. The alternative scenario (bearish) targets $61.0 and $55.0.
All content on this website — including charts, analysis, price targets, support/resistance levels, and position zones — is generated entirely by AI and provided for educational and informational purposes only.
This is not financial advice. NEXUSNOIR VENTURES SL (the operator of this website) is not a registered investment adviser or broker-dealer. You should not make investment decisions based solely on this information. Always do your own research and consult a qualified financial advisor.
By continuing, you acknowledge that you have read and agree to our full disclaimer & terms of use and privacy policy.