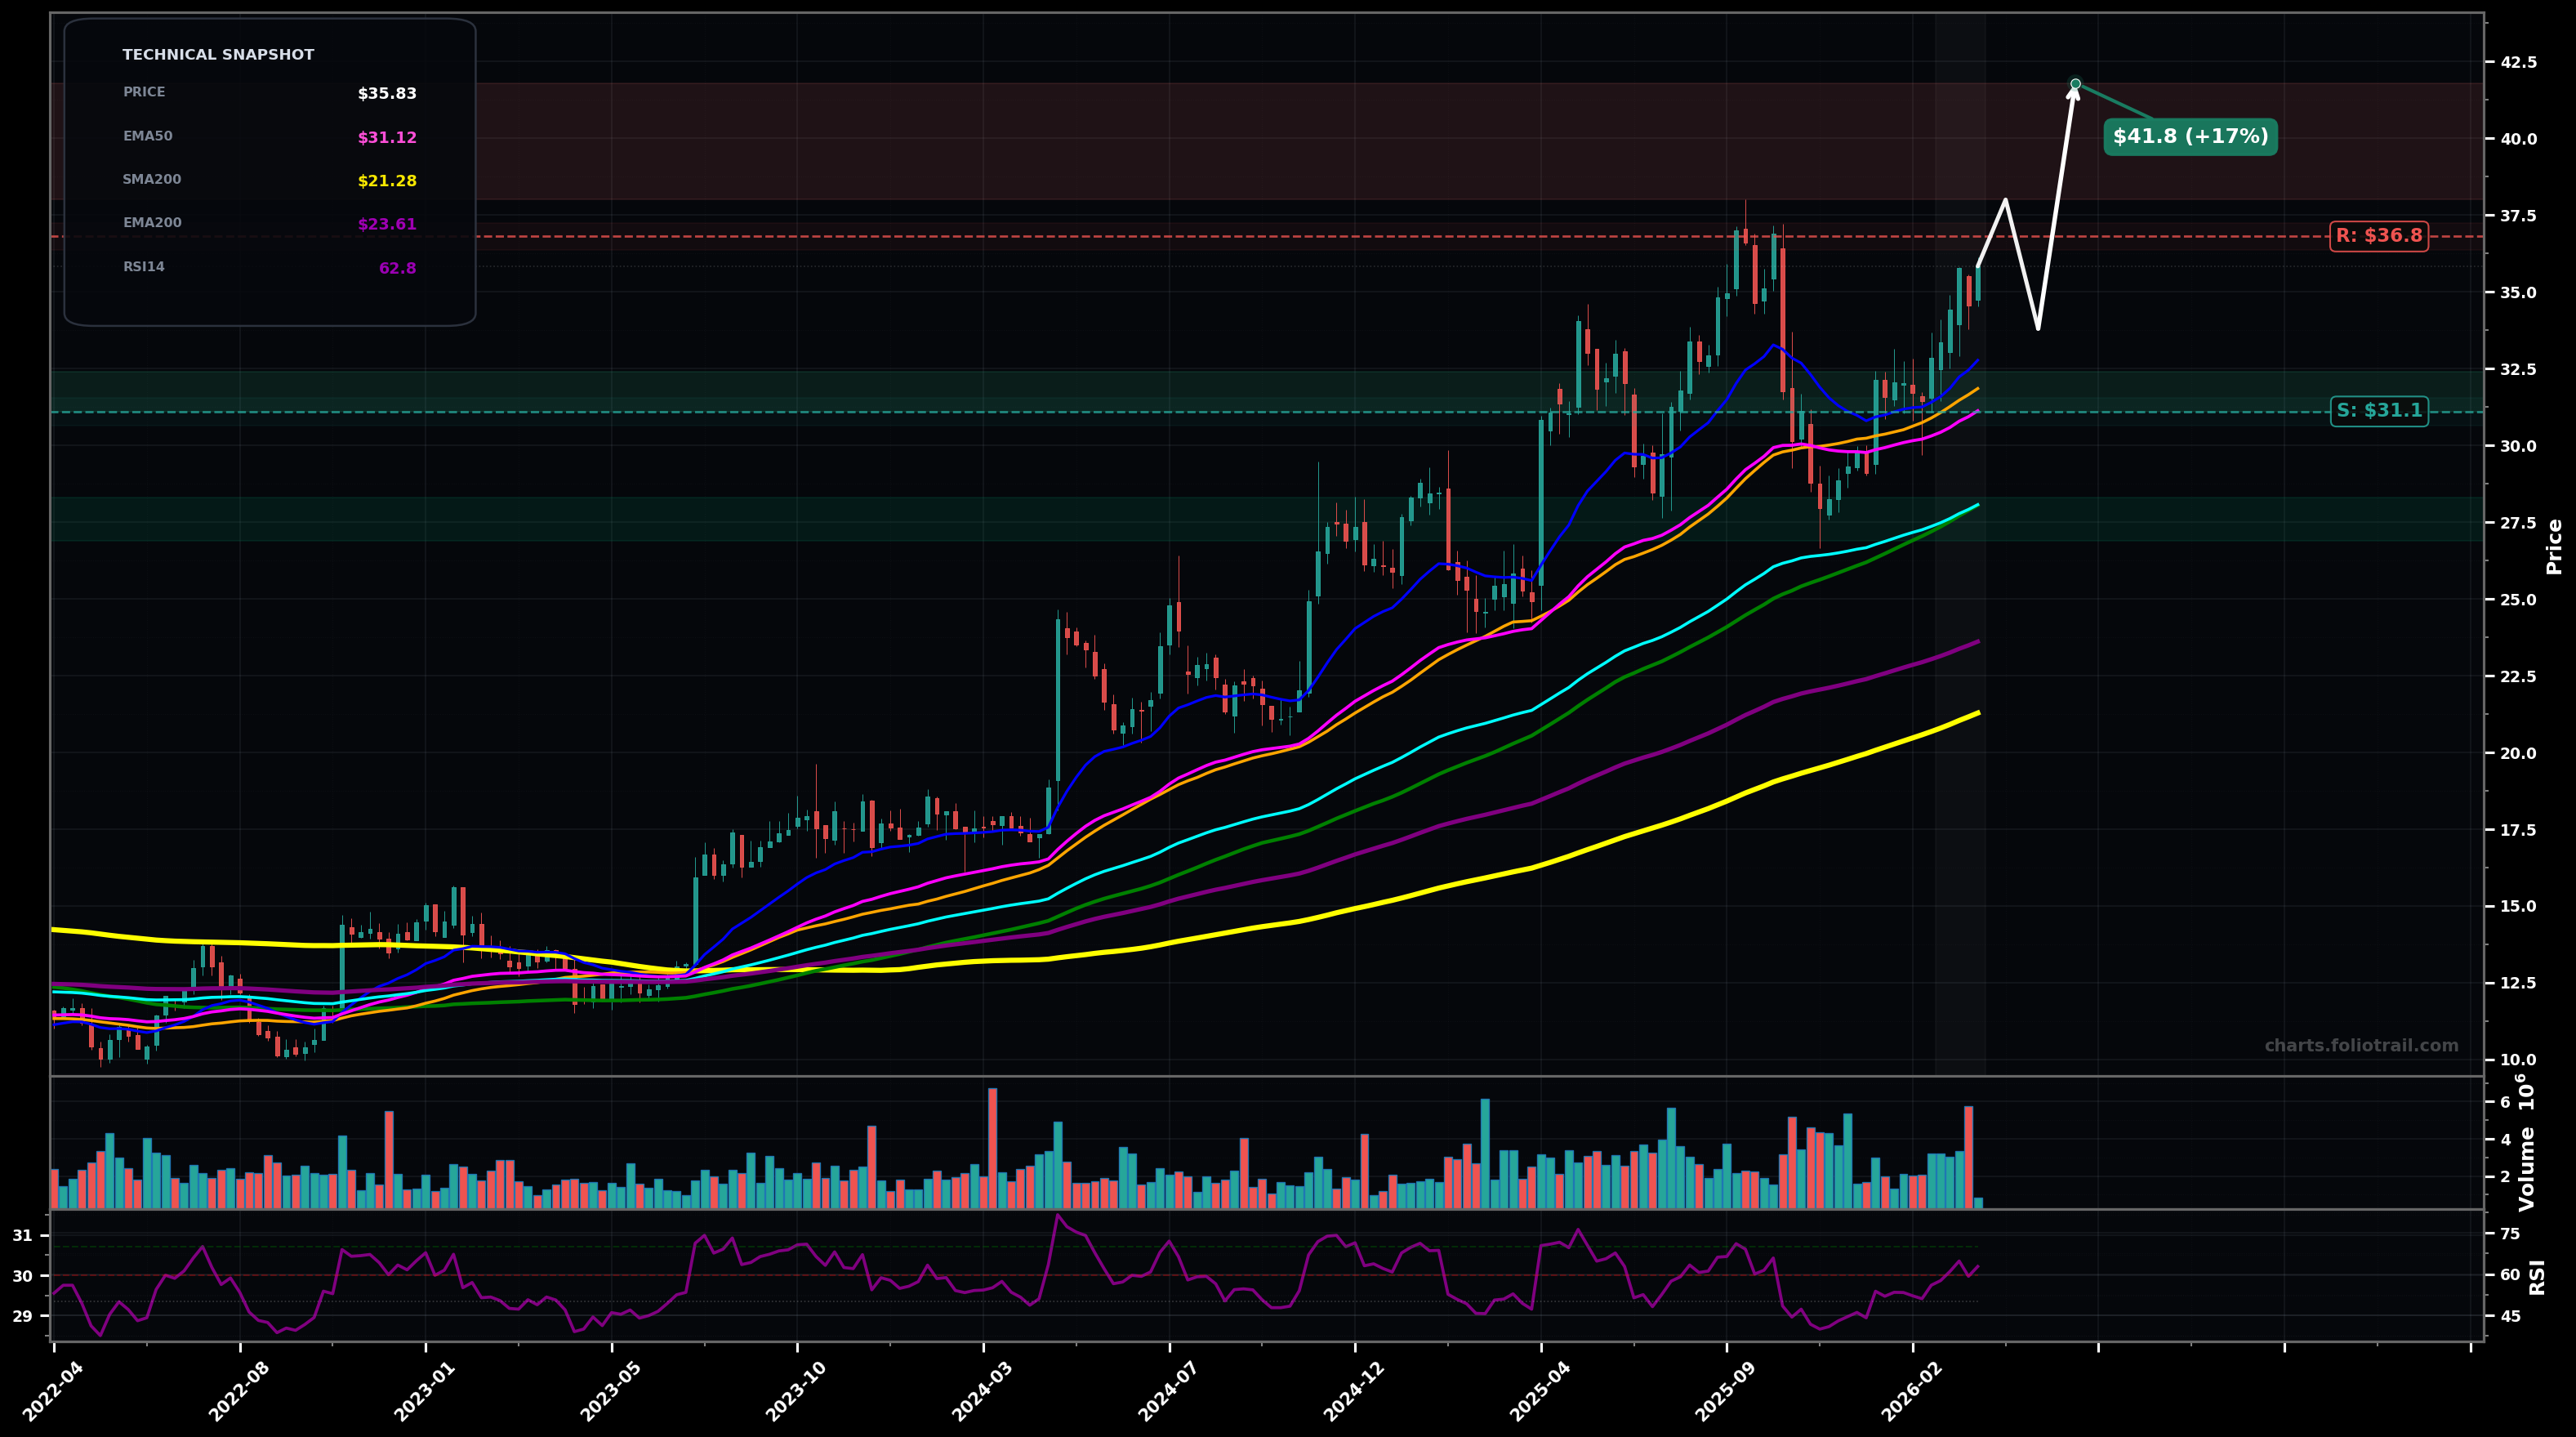
As of March 24, 2026, PRDO (Perdoceo Education Corporation) is in a uptrend state on the weekly chart, with a confidence level of 74%. Key support is at $31.1 and key resistance at $36.8. Weekly uptrend resumed: price pushed back above the short MAs with EMA50 curling up; RSI ~63 (bullish momentum).
Bullish continuation: consolidation above $34 then breakout through $36.80 with follow-through; likely Wave (5) extension after a Wave (4) pullback into the $29-$31 zone (Fib 38.2%-50% of the prior leg).
Bearish pullback / failed breakout: rejection near $36-$37 leads to a deeper mean reversion toward EMA100/SMA100; still a higher-low if it holds the $28-$29 area.
Weekly close above $36.80 holding for 2+ weeks (breaks the prior supply zone).
Weekly close below $30.80 (loss of EMA50/SMA50 area and recent swing structure).
Ladder into trend supports: EMA50/SMA50 first, then prior breakout/pivot zone $29-$31, then EMA100/SMA100 confluence if volatility expands.
Trim into prior-high/extension zones: first at breakout targets, heavier into likely Fib extensions above the prior peak; full exit only if price becomes multi-year stretched far above rising mid/long MAs.
As of March 24, 2026, PRDO (Perdoceo Education Corporation) is in a uptrend state on the weekly chart with 74% confidence. Weekly uptrend resumed: price pushed back above the short MAs with EMA50 curling up; RSI ~63 (bullish momentum).
On the weekly timeframe, PRDO has key support at $31.1 and key resistance at $36.8. The most likely scenario (bullish) targets $38.0 and $41.8, with a revert level at $33.8.
PRDO (Perdoceo Education Corporation) is currently classified as uptrend on the weekly chart, with 74% confidence. Confirmation requires: Weekly close above $36.80 holding for 2+ weeks (breaks the prior supply zone). This would be invalidated by: Weekly close below $30.80 (loss of EMA50/SMA50 area and recent swing structure).
The most likely scenario (bullish) targets $38.0 and $41.8, with a revert level at $33.8. The alternative scenario (bearish) targets $31.0 and $28.1.
All content on this website — including charts, analysis, price targets, support/resistance levels, and position zones — is generated entirely by AI and provided for educational and informational purposes only.
This is not financial advice. NEXUSNOIR VENTURES SL (the operator of this website) is not a registered investment adviser or broker-dealer. You should not make investment decisions based solely on this information. Always do your own research and consult a qualified financial advisor.
By continuing, you acknowledge that you have read and agree to our full disclaimer & terms of use and privacy policy.