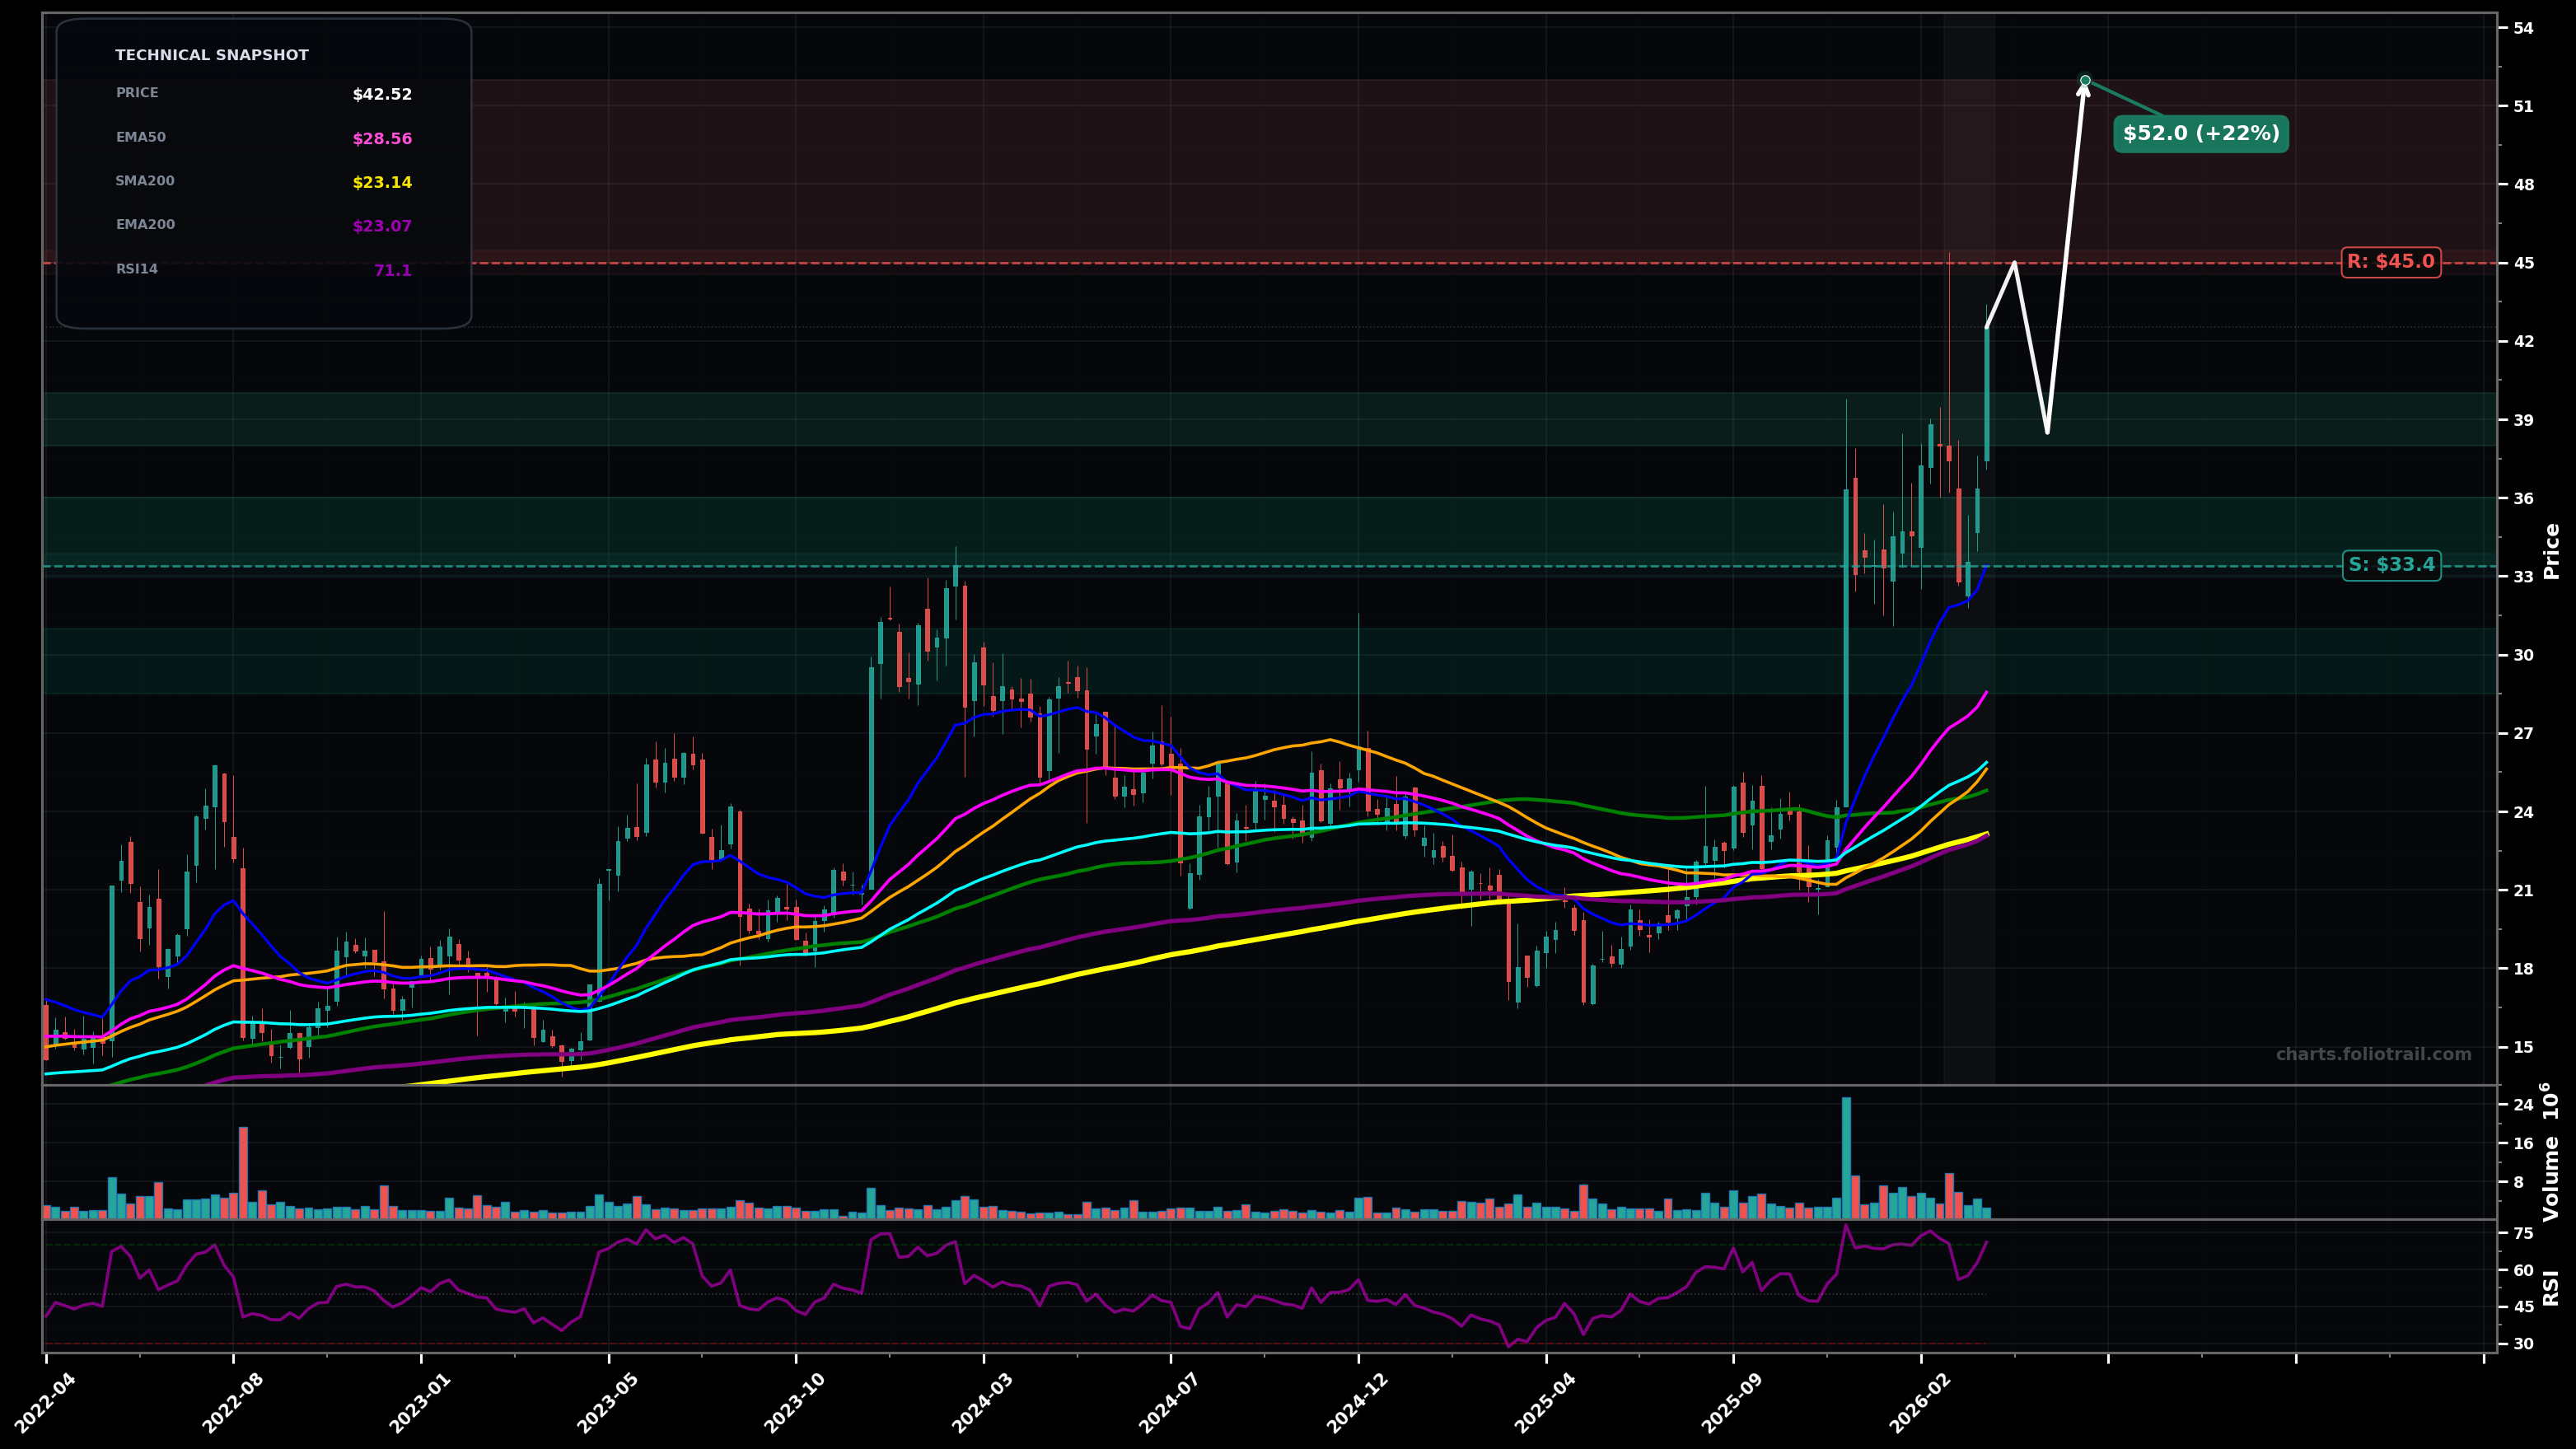
As of March 25, 2026, PLAB (Photronics Inc.) is in a uptrend state on the weekly chart, with a confidence level of 74%. Key support is at $33.4 and key resistance at $45.0. Weekly HH/HL sequence with a sharp breakout on expanding volume; price is extended above rising EMA50/EMA100 and RSI is overbought (~71).
Bullish continuation: wave-3/5 style extension after the base breakout; brief pullback/basing above the breakout zone then push to new highs (watch for momentum divergence as RSI is already elevated).
Bearish digestion: post-breakout mean-reversion/ABC pullback (Elliott wave 4-type) toward the rising fast MAs; trend remains intact if it holds above prior breakout support.
Weekly close above $43.00 (follow-through breakout) and then hold above $40.00 on any pullback
Weekly close below $33.40 (loss of EMA20 area and breakout structure)
Start on a controlled pullback toward prior breakout/round-number support; add on EMA20-to-structure retest; heavy add only if a deeper wave-4 style retrace tags EMA50/upper MA cluster while keeping the long-term uptrend intact.
Trim into resistance/new ATH extensions (likely fib extensions from the $20-$22 base to $42+ impulse); heavier trimming if price accelerates far above EMA50 (parabolic risk), and close into extreme multi-year extension zones.
As of March 25, 2026, PLAB (Photronics Inc.) is in a uptrend state on the weekly chart with 74% confidence. Weekly HH/HL sequence with a sharp breakout on expanding volume; price is extended above rising EMA50/EMA100 and RSI is overbought (~71).
On the weekly timeframe, PLAB has key support at $33.4 and key resistance at $45.0. The most likely scenario (bullish) targets $45.0 and $52.0, with a revert level at $38.5.
PLAB (Photronics Inc.) is currently classified as uptrend on the weekly chart, with 74% confidence. Confirmation requires: Weekly close above $43.00 (follow-through breakout) and then hold above $40.00 on any pullback This would be invalidated by: Weekly close below $33.40 (loss of EMA20 area and breakout structure)
The most likely scenario (bullish) targets $45.0 and $52.0, with a revert level at $38.5. The alternative scenario (bearish) targets $38.5 and $33.4.
Multi-layer AI agents analyse 200+ stocks across daily, weekly, and monthly timeframes — producing market state classifications, price scenarios with targets, and position entry/exit levels. Updated every trading day after market close. No paywall. No sign-up required.
Built by Foliotrail.
All content on this website — including charts, analysis, price targets, support/resistance levels, and position zones — is generated entirely by AI and provided for educational and informational purposes only.
This is not financial advice. NEXUSNOIR VENTURES SL (the operator of this website) is not a registered investment adviser or broker-dealer. You should not make investment decisions based solely on this information. Always do your own research and consult a qualified financial advisor.
By continuing, you acknowledge that you have read and agree to our full disclaimer & terms of use and privacy policy.