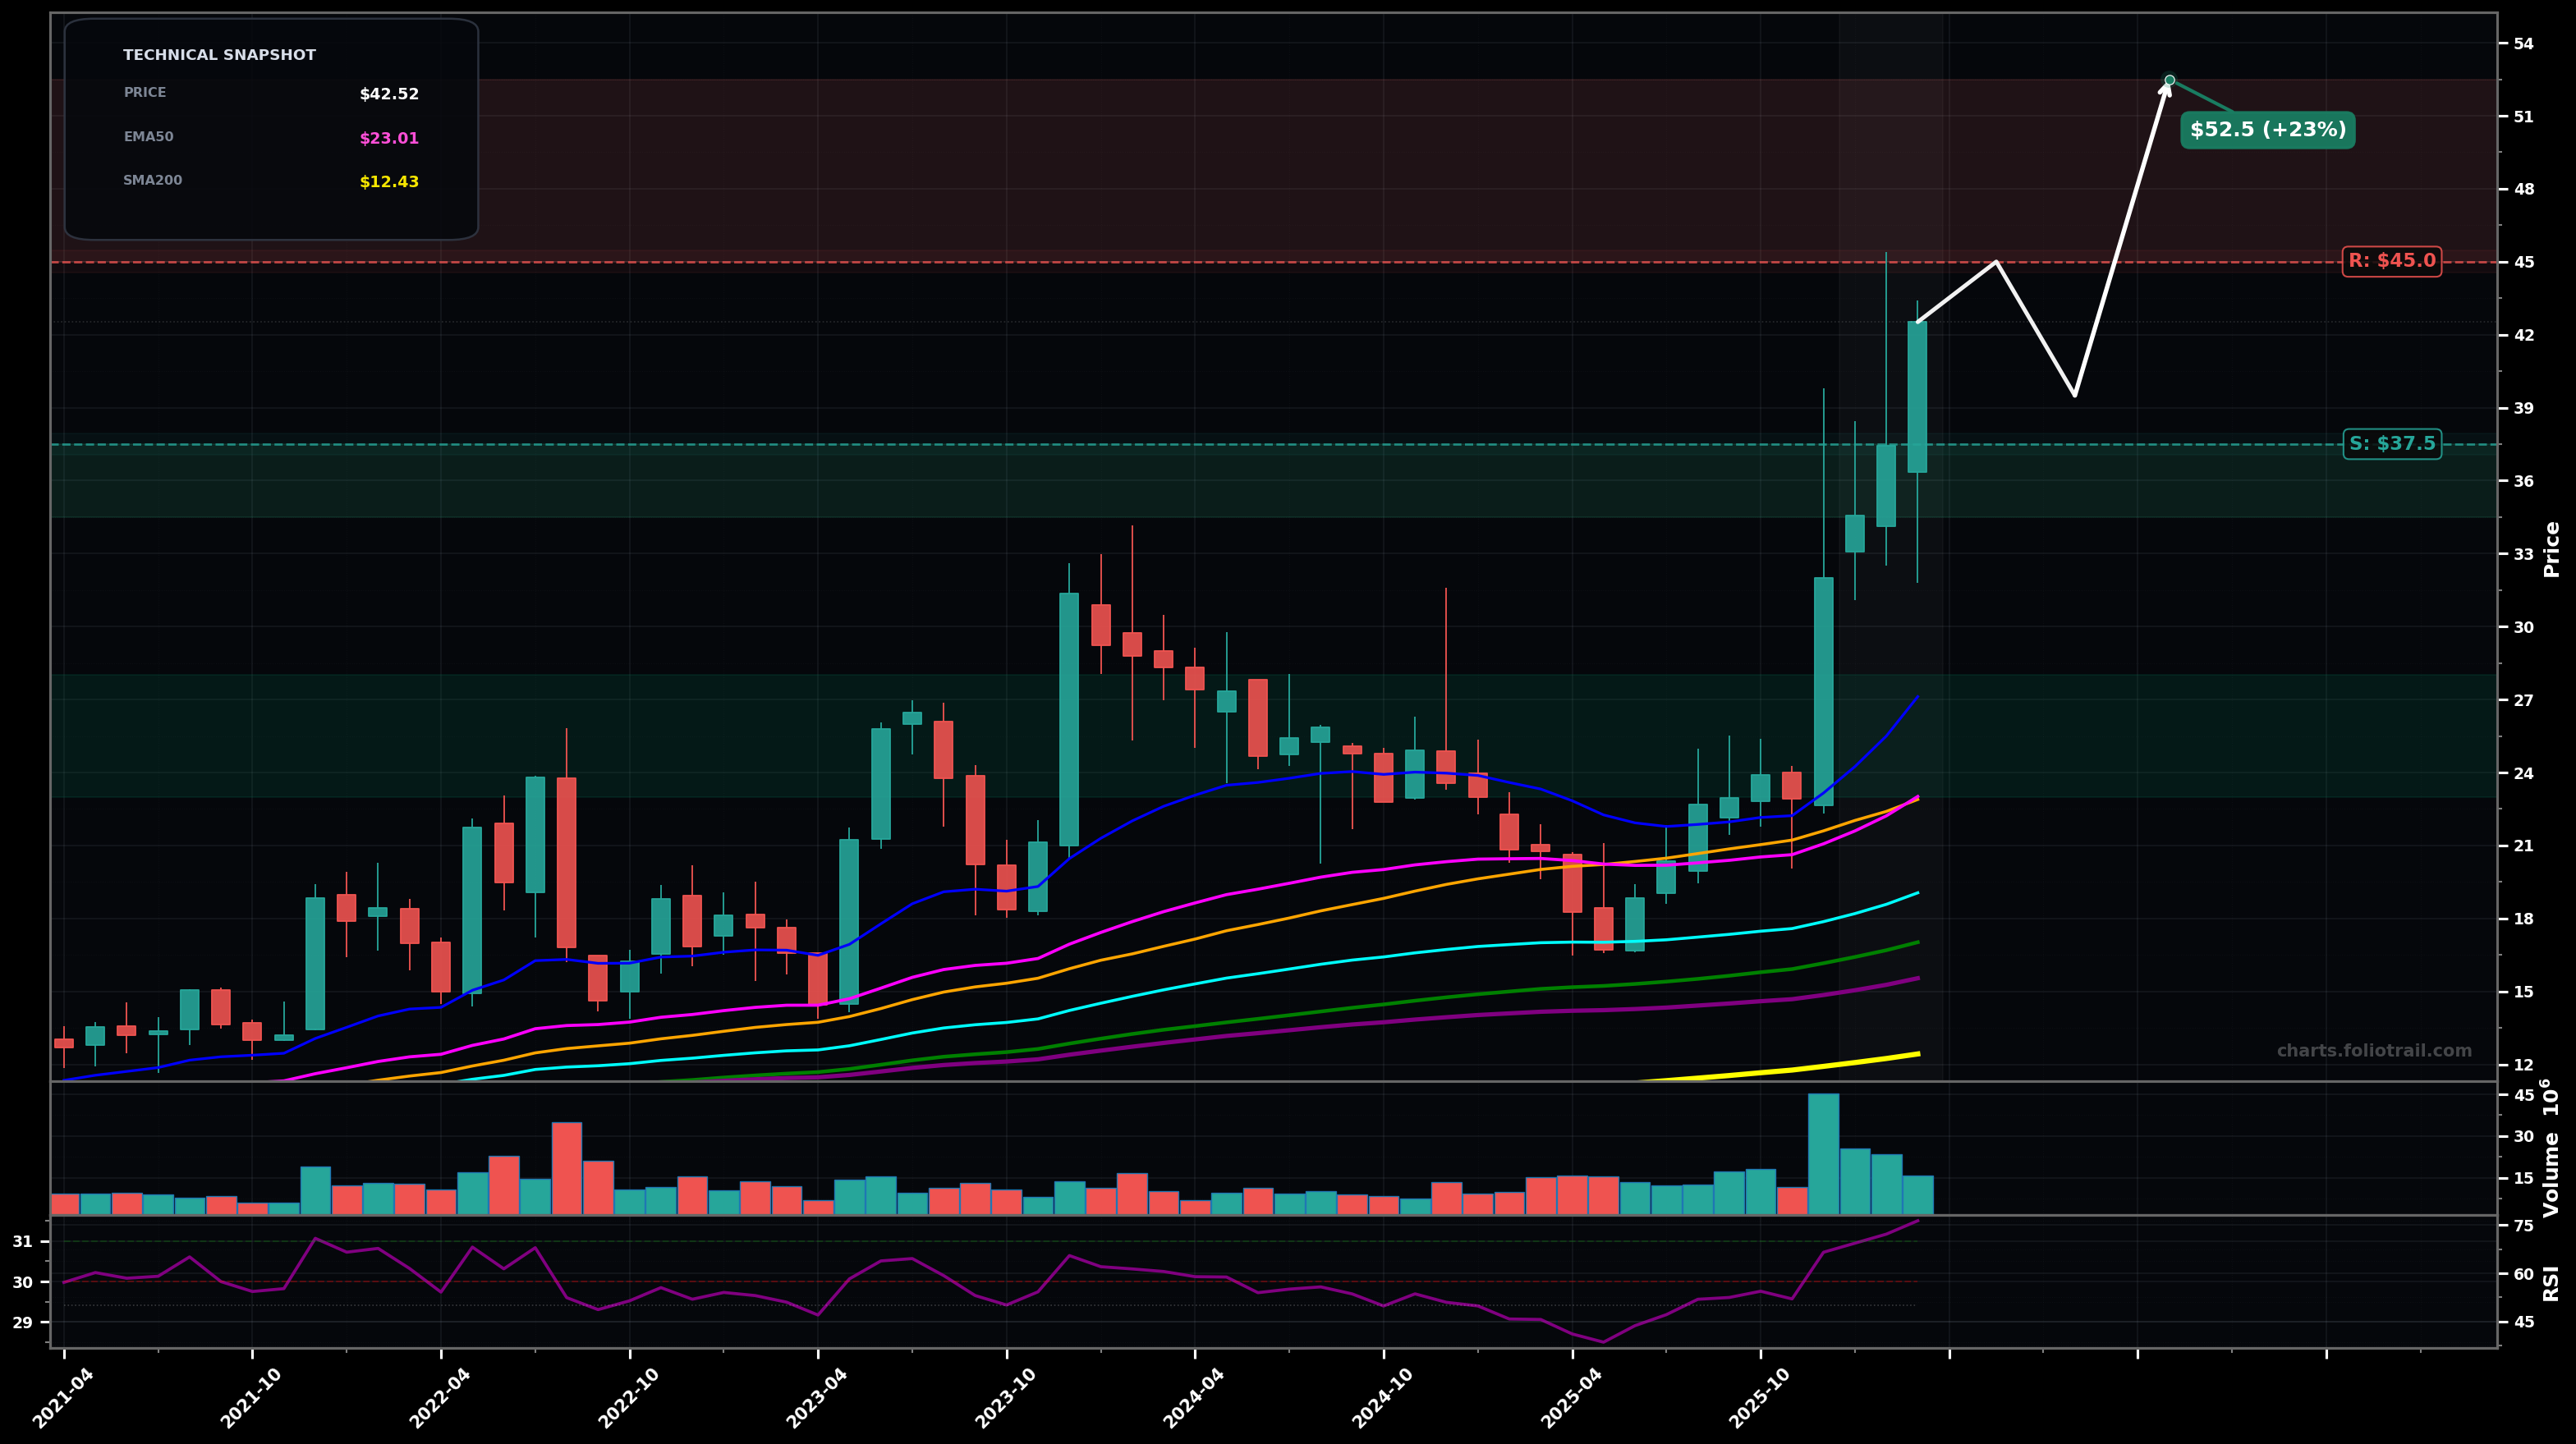
As of March 25, 2026, PLAB (Photronics Inc.) is in a parabolic state on the monthly chart, with a confidence level of 72%. Key support is at $37.5 and key resistance at $45.0. Monthly breakout with consecutive strong green candles, new HH above prior range/peak; price extended far above rising EMA50/100 on volume; RSI-14 ~76 (overbought/extension).
Bullish continuation: a brief consolidation/pullback holds above the breakout zone ($37.50 area), then price grinds higher toward the next psychological/extension levels; fits an Elliott Wave impulse where price is likely in a late Wave 3 or early Wave 5 extension (higher volatility, but trend up).
Mean-reversion pullback: parabolic move cools off with a deeper retrace toward fast MAs; a monthly rejection near $45 triggers a Wave 4-style correction toward prior breakout + EMA50 region before trend decision (continuation vs larger top).
Monthly close holding above $37.50
Monthly close back below $32.00
Buy zones bracket the breakout retest ($37.5), then deeper Fib-style retrace into prior structure, with heavy adds near EMA50 (~$23) / prior base where risk-reward improves if the uptrend remains intact.
Trims scale into upside extensions above the current breakout/highs where parabolic/Wave-5 risk rises; full exit only if price reaches extreme multi-year extension zones relative to major MAs (EMA200/SMA200 far below).
As of March 25, 2026, PLAB (Photronics Inc.) is in a parabolic state on the monthly chart with 72% confidence. Monthly breakout with consecutive strong green candles, new HH above prior range/peak; price extended far above rising EMA50/100 on volume; RSI-14 ~76 (overbought/extension).
On the monthly timeframe, PLAB has key support at $37.5 and key resistance at $45.0. The most likely scenario (bullish) targets $45.0 and $52.5, with a revert level at $39.5.
PLAB (Photronics Inc.) is currently classified as parabolic on the monthly chart, with 72% confidence. Confirmation requires: Monthly close holding above $37.50 This would be invalidated by: Monthly close back below $32.00
The most likely scenario (bullish) targets $45.0 and $52.5, with a revert level at $39.5. The alternative scenario (bearish) targets $34.5 and $28.0.
Multi-layer AI agents analyse 200+ stocks across daily, weekly, and monthly timeframes — producing market state classifications, price scenarios with targets, and position entry/exit levels. Updated every trading day after market close. No paywall. No sign-up required.
Built by Foliotrail.
All content on this website — including charts, analysis, price targets, support/resistance levels, and position zones — is generated entirely by AI and provided for educational and informational purposes only.
This is not financial advice. NEXUSNOIR VENTURES SL (the operator of this website) is not a registered investment adviser or broker-dealer. You should not make investment decisions based solely on this information. Always do your own research and consult a qualified financial advisor.
By continuing, you acknowledge that you have read and agree to our full disclaimer & terms of use and privacy policy.