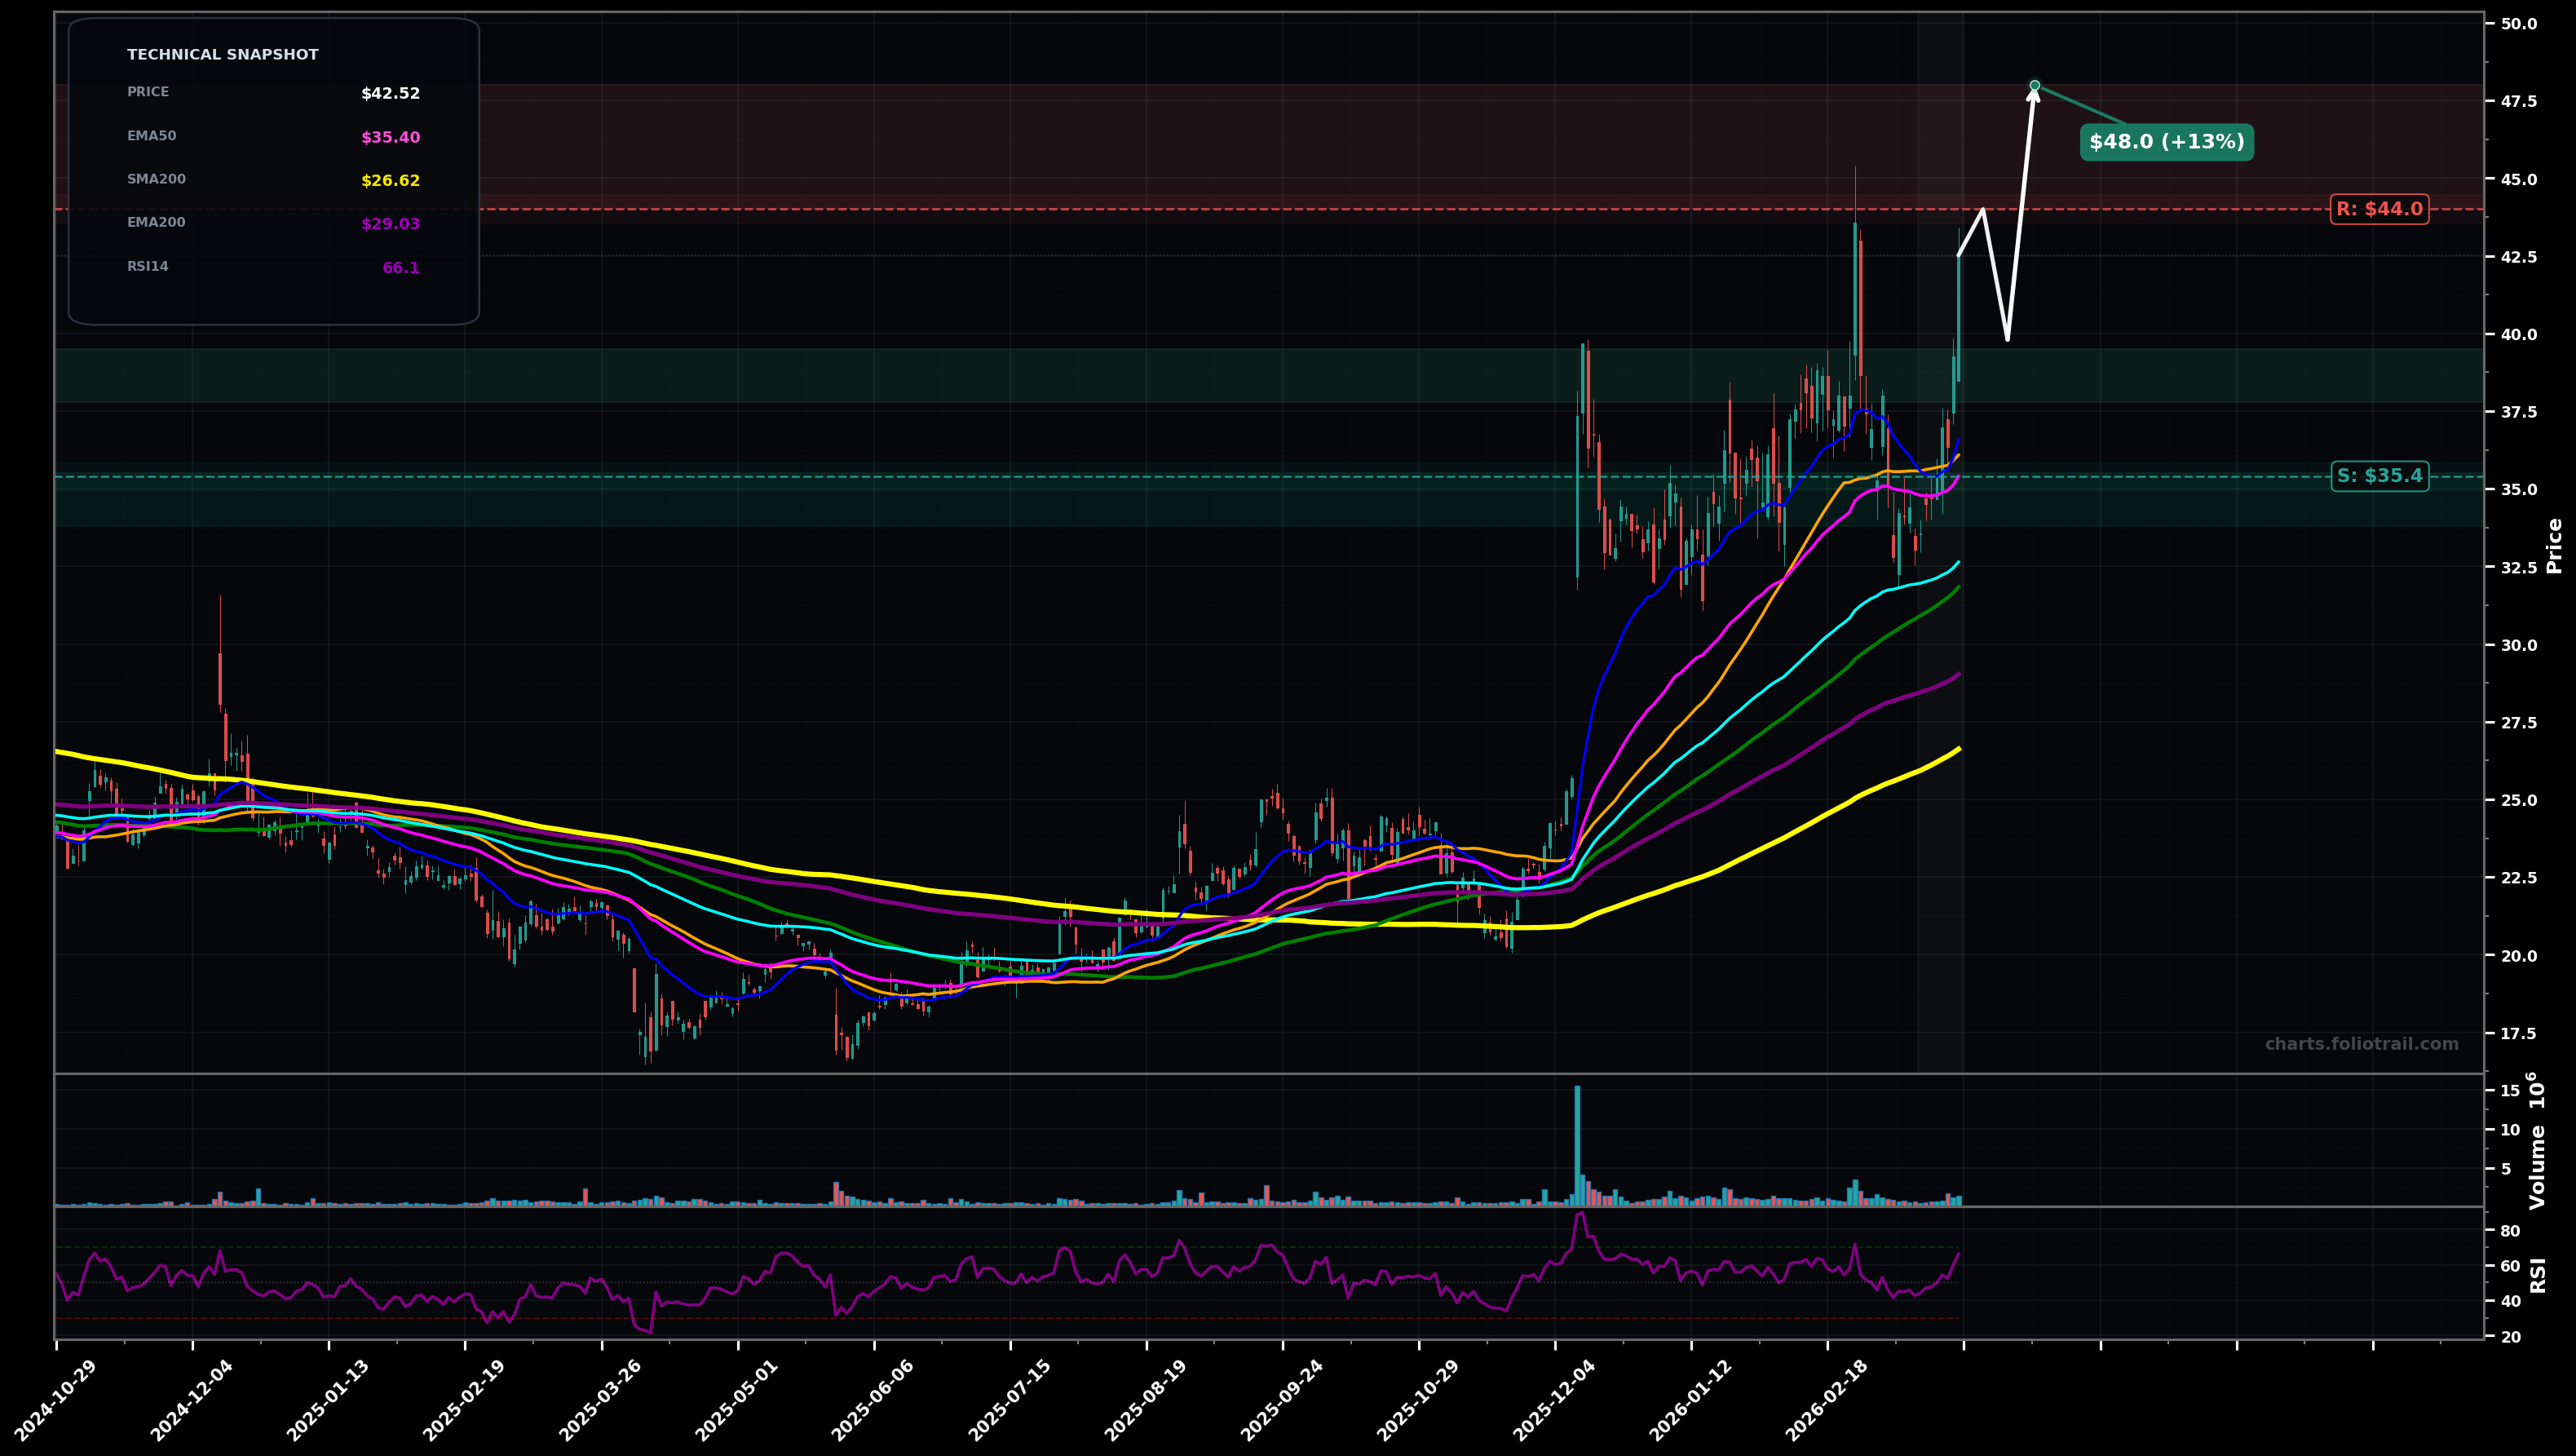
As of March 25, 2026, PLAB (Photronics Inc.) is in a uptrend state on the daily chart, with a confidence level of 72%. Key support is at $35.4 and key resistance at $44.0. Price at $42.52 with a sharp upside push from the $35–$37 area; strong separation above short/mid MAs and RSI ~66 showing momentum.
Bullish continuation: price consolidates briefly above the rising EMA50 then pushes through the $44.00 prior high, extending the trend (likely Wave 5 extension / post-Wave-4 break).
Bearish pullback/mean reversion: rejection near $44.00 leads to a deeper retrace toward the confluence of EMA50 and the prior breakout zone; would likely count as a Wave 4-style pullback before trend decision.
Daily closes hold above $40.00 and then break/hold above $44.00 (prior swing high zone).
Daily close below $35.40 (EMA50 area) would break the current HL/MA support.
Buy-the-dip zones centered on rising EMA50 (~$35.4) and the prior breakout/swing structure; heavy add only if price tags/undercuts support but holds above the deeper trend area near EMA100/structure.
Trim into prior-high breakout ($44) and possible fib-extension territory (~$48+); larger derisk/exit only if price becomes parabolic and far stretched above EMA50/EMA100 with momentum exhaustion risk.
As of March 25, 2026, PLAB (Photronics Inc.) is in a uptrend state on the daily chart with 72% confidence. Price at $42.52 with a sharp upside push from the $35–$37 area; strong separation above short/mid MAs and RSI ~66 showing momentum.
On the daily timeframe, PLAB has key support at $35.4 and key resistance at $44.0. The most likely scenario (bullish) targets $44.0 and $48.0, with a revert level at $39.8.
PLAB (Photronics Inc.) is currently classified as uptrend on the daily chart, with 72% confidence. Confirmation requires: Daily closes hold above $40.00 and then break/hold above $44.00 (prior swing high zone). This would be invalidated by: Daily close below $35.40 (EMA50 area) would break the current HL/MA support.
The most likely scenario (bullish) targets $44.0 and $48.0, with a revert level at $39.8. The alternative scenario (bearish) targets $37.0 and $34.0.
Multi-layer AI agents analyse 200+ stocks across daily, weekly, and monthly timeframes — producing market state classifications, price scenarios with targets, and position entry/exit levels. Updated every trading day after market close. No paywall. No sign-up required.
Built by Foliotrail.
All content on this website — including charts, analysis, price targets, support/resistance levels, and position zones — is generated entirely by AI and provided for educational and informational purposes only.
This is not financial advice. NEXUSNOIR VENTURES SL (the operator of this website) is not a registered investment adviser or broker-dealer. You should not make investment decisions based solely on this information. Always do your own research and consult a qualified financial advisor.
By continuing, you acknowledge that you have read and agree to our full disclaimer & terms of use and privacy policy.