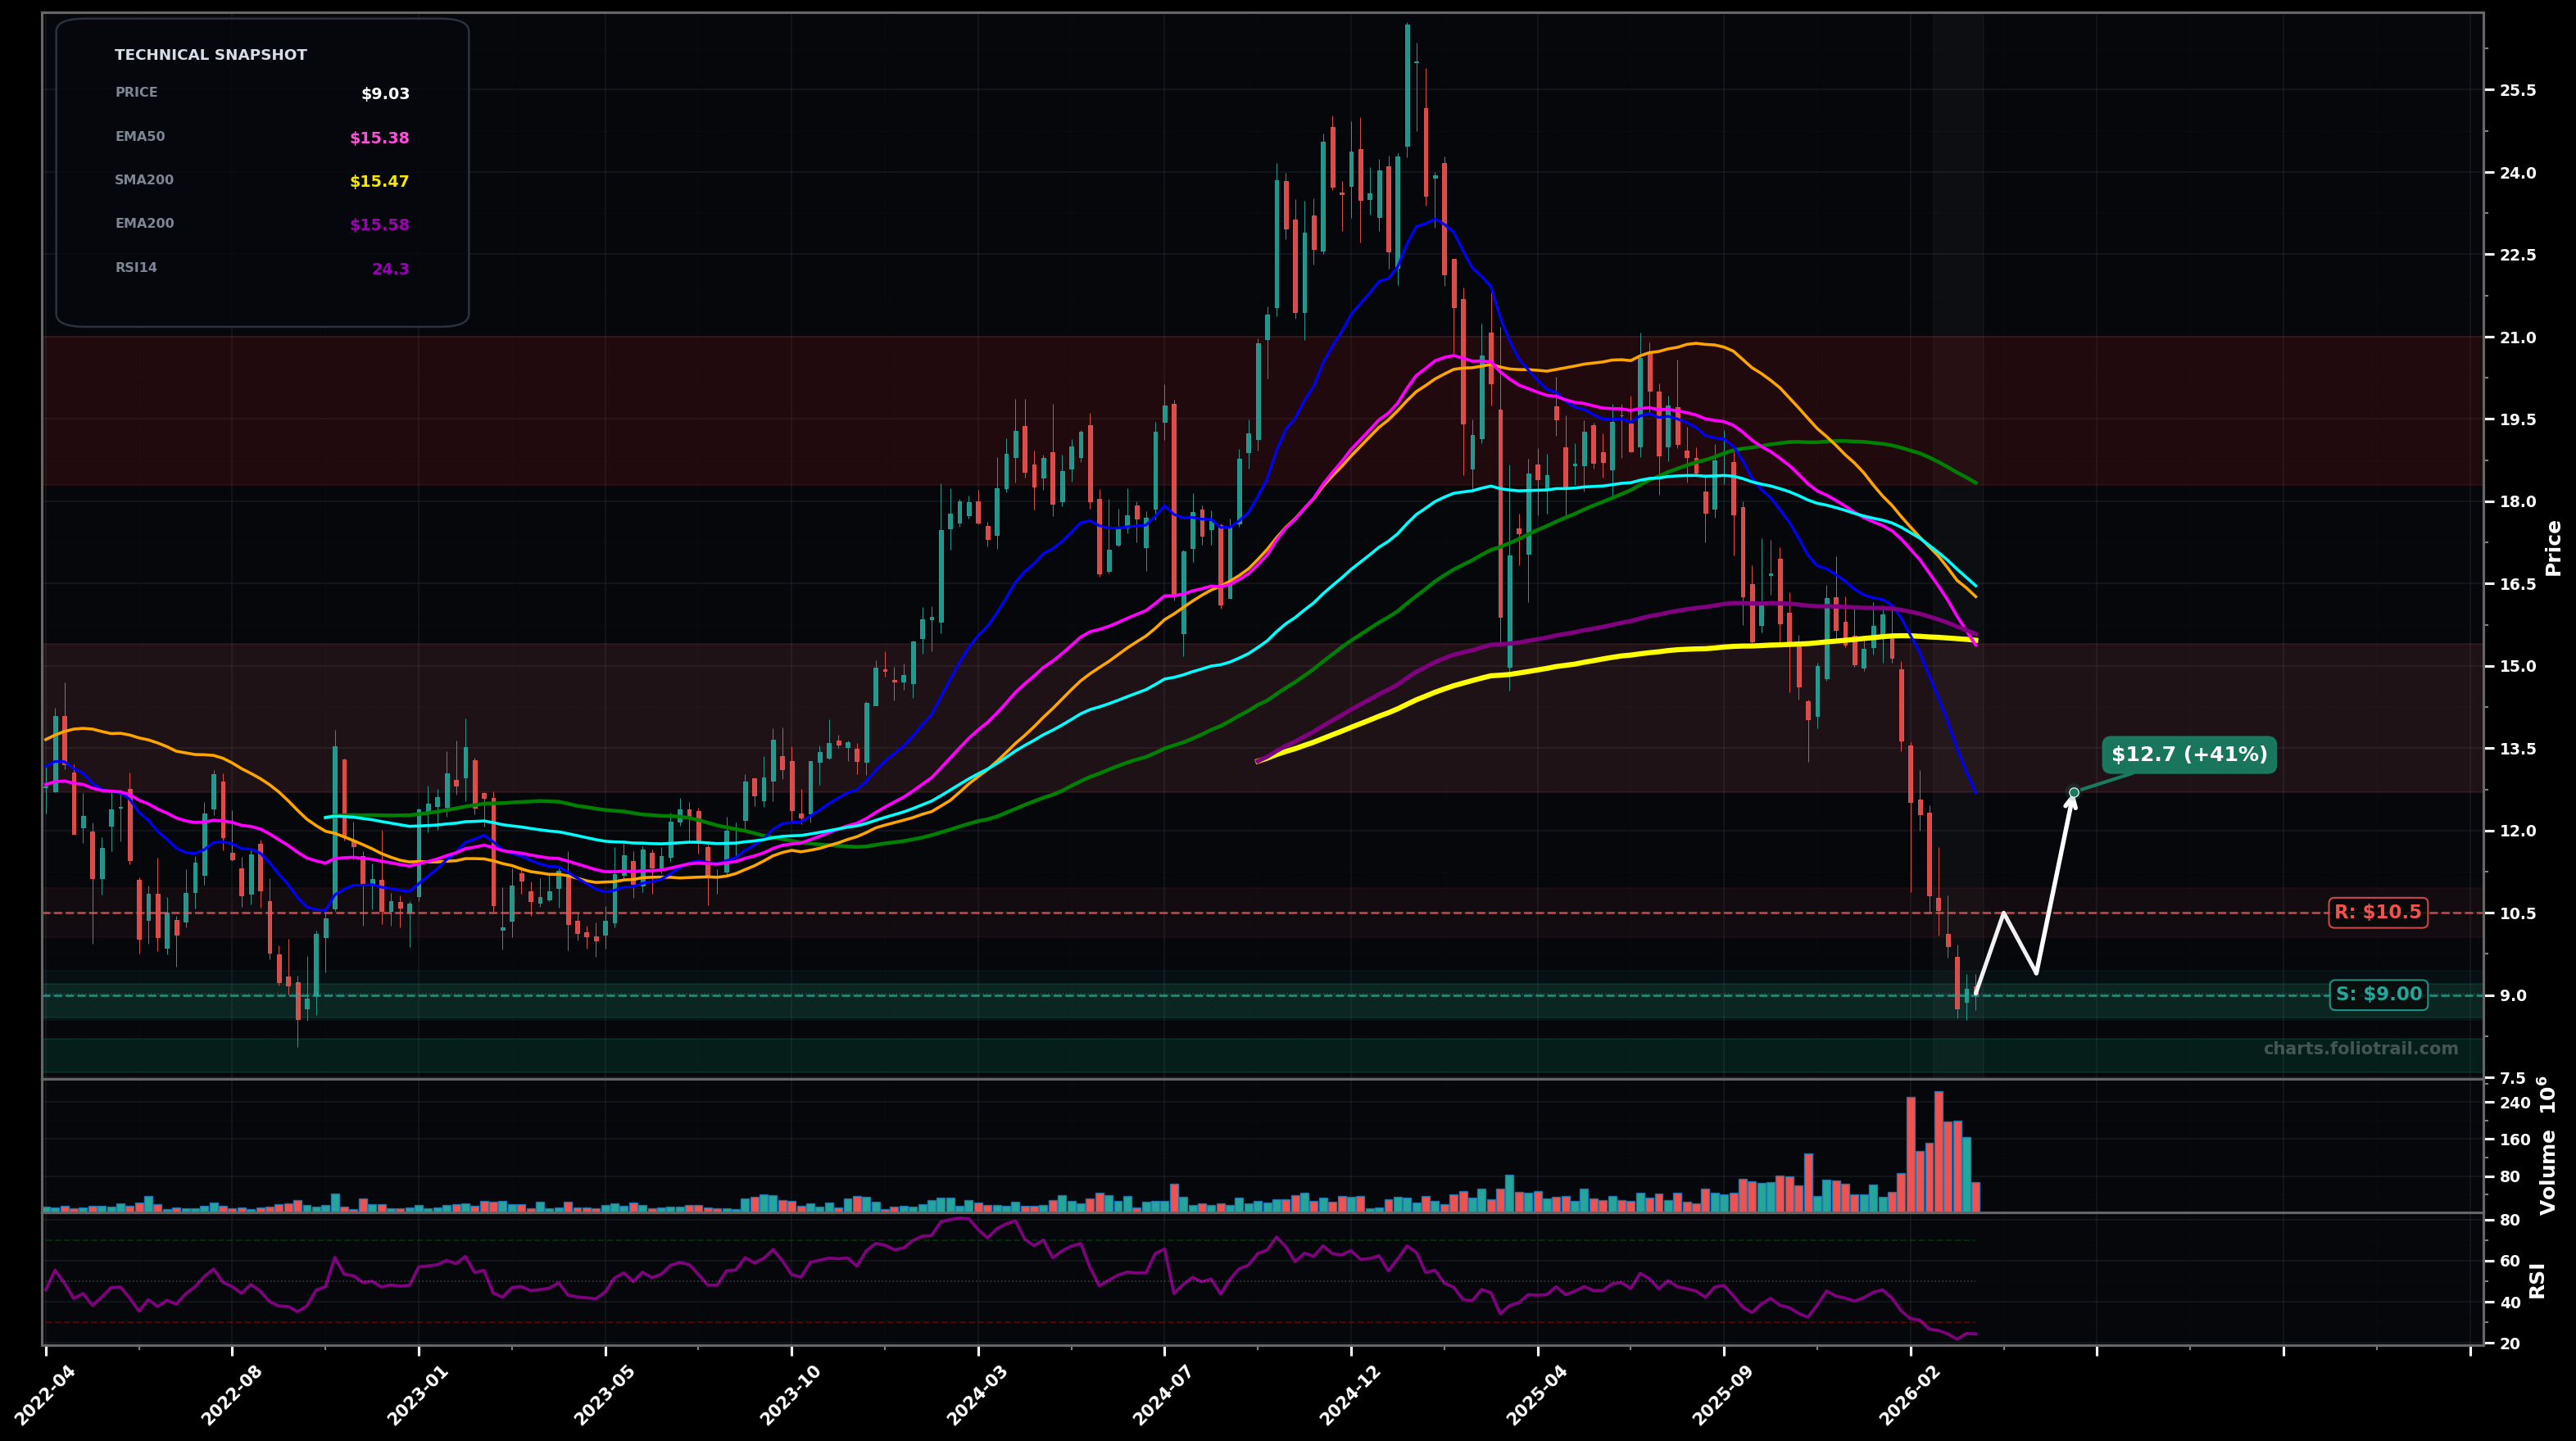
As of March 26, 2026, OWL (Blue Owl Capital Inc.) is in a falling knife state on the weekly chart, with a confidence level of 82%. Key support is at $9.00 and key resistance at $10.5. Sharp selloff with multiple large red closes; price at ~$9.03 far below all key MAs and accelerating into new swing lows with heavy volume; RSI deeply oversold (~24).
Dead-cat bounce / oversold relief rally into prior breakdown area, then rejection under falling short MAs; trend remains bearish unless it forms a weekly HH/HL.
Continuation breakdown: loses the $9 area decisively and extends the impulse down; next it attempts a base only after capitulation volume fades.
Weekly close below $8.80 (continuation to fresh lows).
Two consecutive weekly closes back above $12.70 (EMA20) with a higher low.
Scale only near support/new-low zones while RSI is washed-out; add more only if selling pressure starts to fade and a higher low/undercut-and-rally appears.
Trim into mean-reversion levels: EMA20/EMA50 first, then EMA100/SMA100; full exit zone aligns with prior distribution area + major MA cluster overhead.
As of March 26, 2026, OWL (Blue Owl Capital Inc.) is in a falling knife state on the weekly chart with 82% confidence. Sharp selloff with multiple large red closes; price at ~$9.03 far below all key MAs and accelerating into new swing lows with heavy volume; RSI deeply oversold (~24).
On the weekly timeframe, OWL has key support at $9.00 and key resistance at $10.5. The most likely scenario (bearish) targets $10.5 and $12.7, with a revert level at $9.40.
OWL (Blue Owl Capital Inc.) is currently classified as falling knife on the weekly chart, with 82% confidence. Confirmation requires: Weekly close below $8.80 (continuation to fresh lows). This would be invalidated by: Two consecutive weekly closes back above $12.70 (EMA20) with a higher low.
The most likely scenario (bearish) targets $10.5 and $12.7, with a revert level at $9.40. The alternative scenario (bearish) targets $8.00 and $6.50.
Multi-layer AI agents analyse 200+ stocks across daily, weekly, and monthly timeframes — producing market state classifications, price scenarios with targets, and position entry/exit levels. Updated every trading day after market close. No paywall. No sign-up required.
Built by Foliotrail.
All content on this website — including charts, analysis, price targets, support/resistance levels, and position zones — is generated entirely by AI and provided for educational and informational purposes only.
This is not financial advice. NEXUSNOIR VENTURES SL (the operator of this website) is not a registered investment adviser or broker-dealer. You should not make investment decisions based solely on this information. Always do your own research and consult a qualified financial advisor.
By continuing, you acknowledge that you have read and agree to our full disclaimer & terms of use and privacy policy.