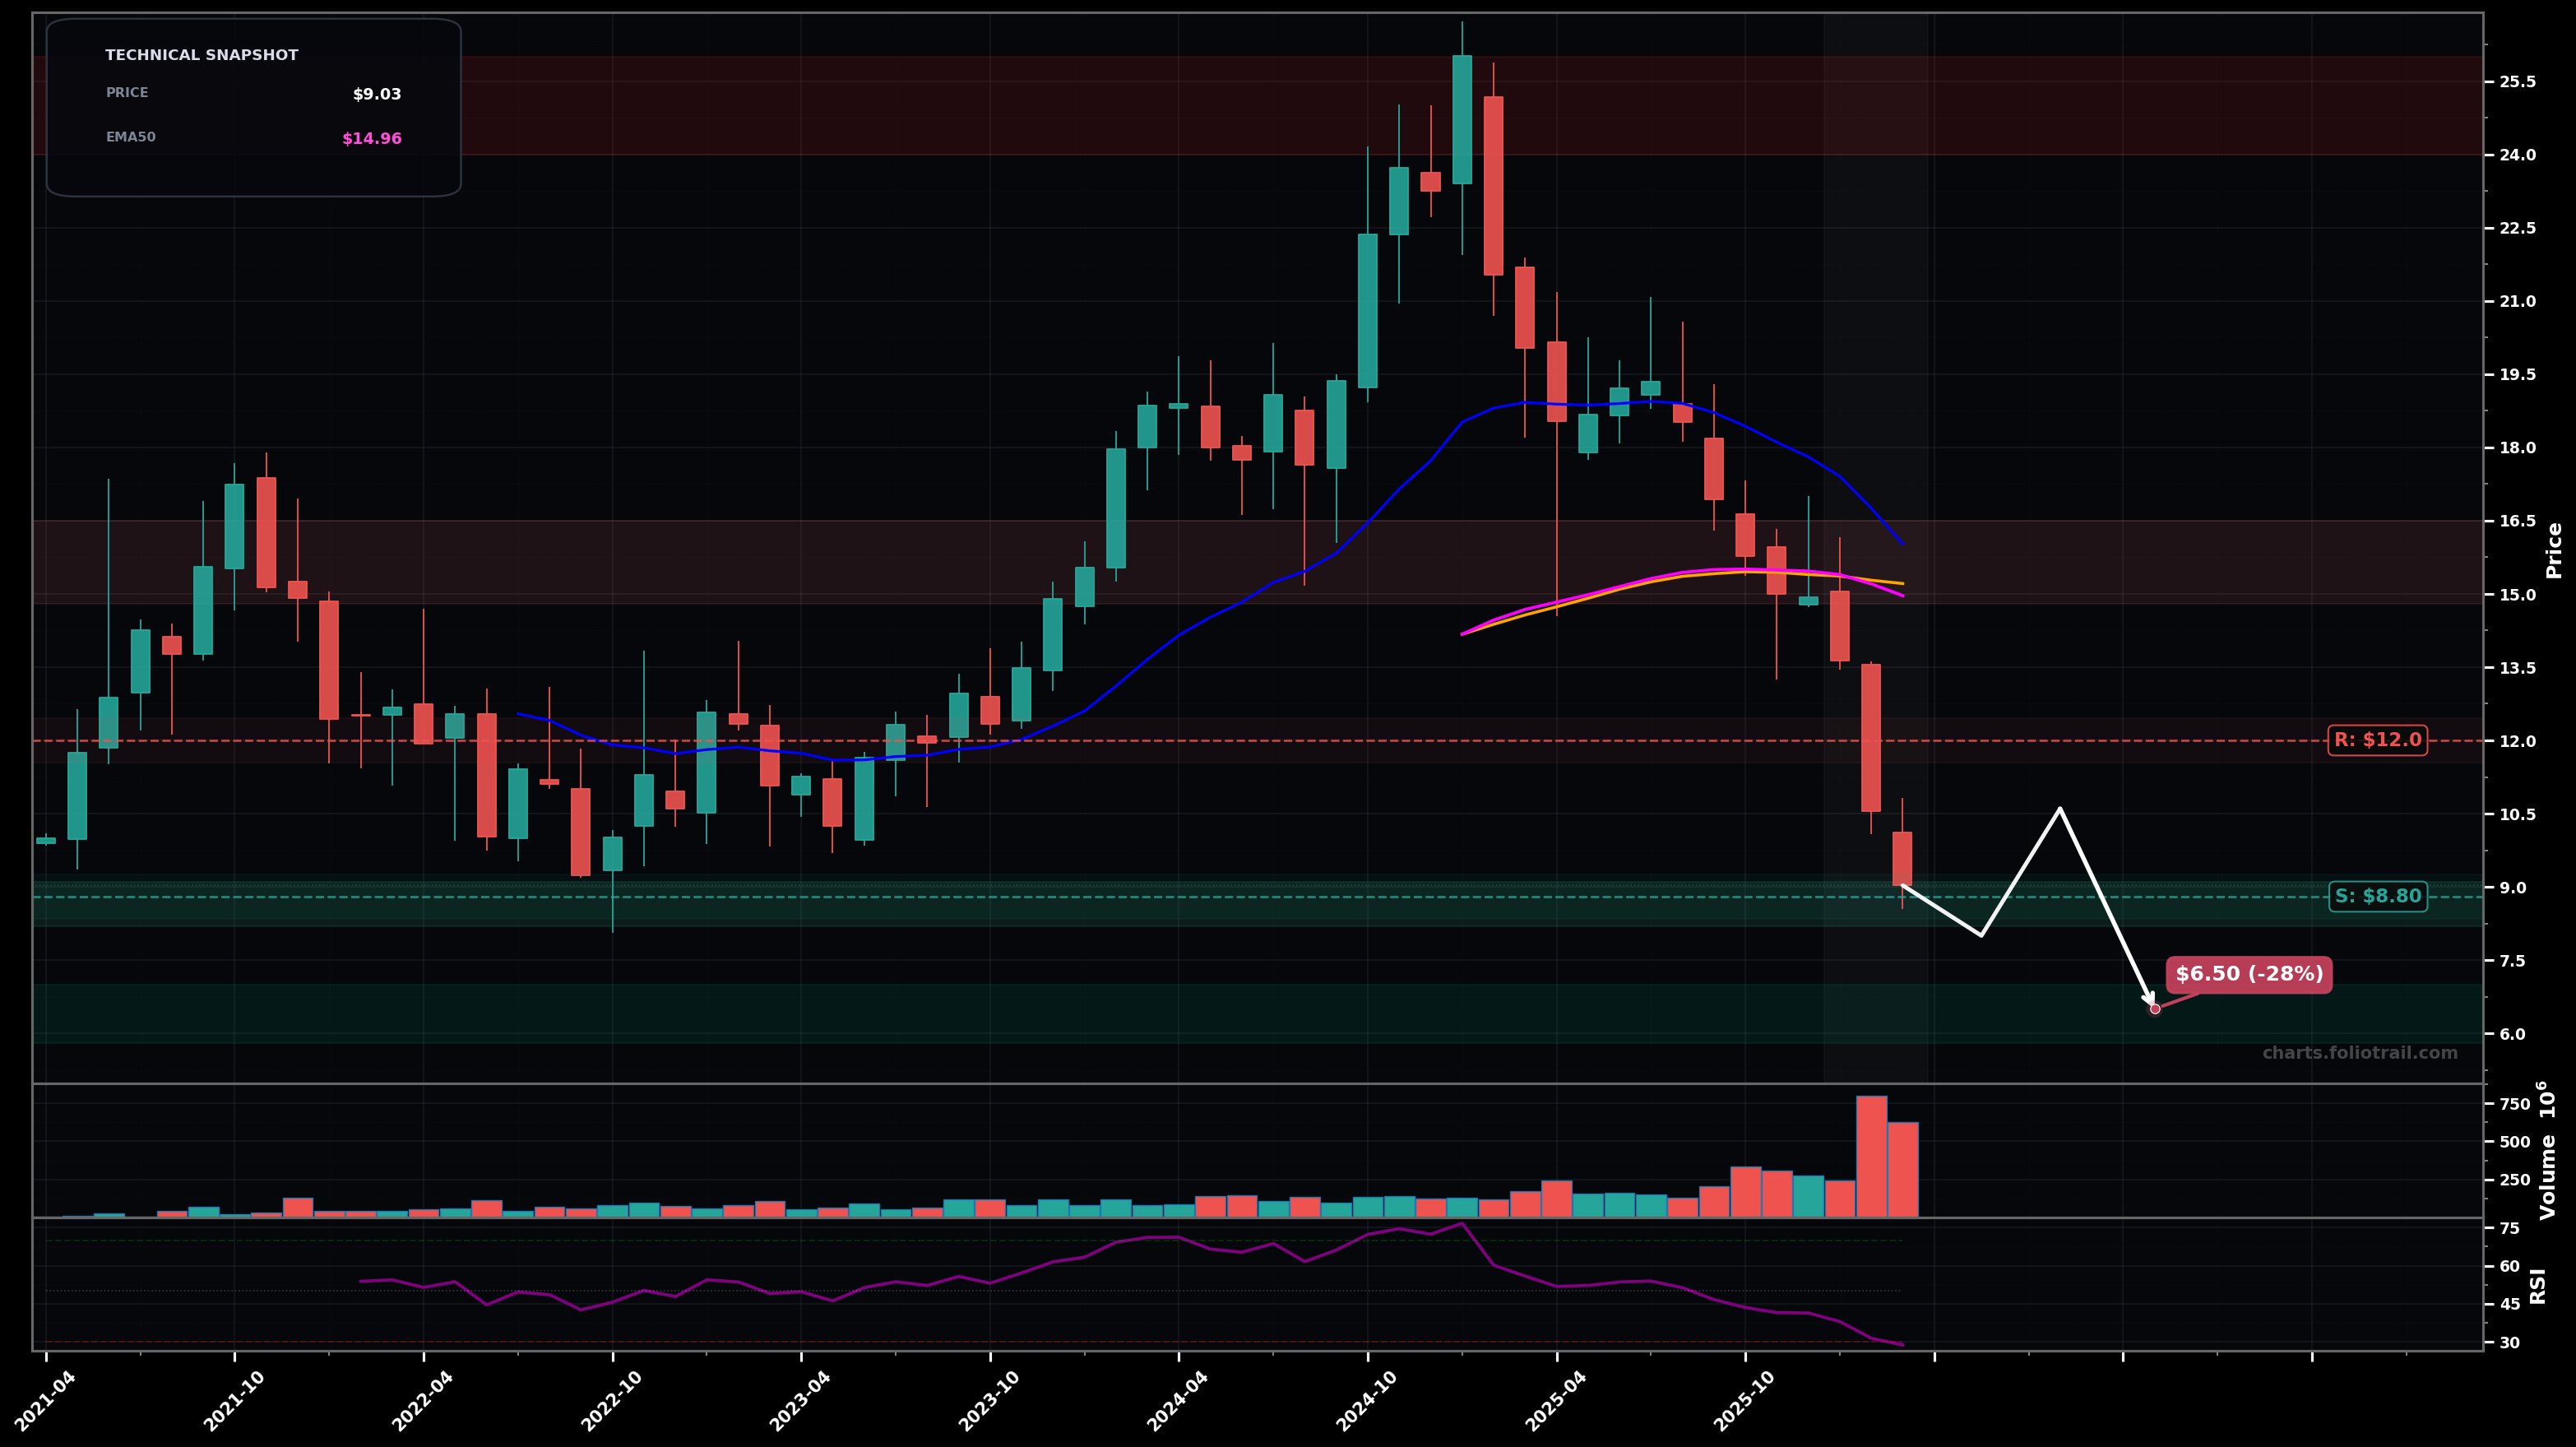
As of March 26, 2026, OWL (Blue Owl Capital Inc.) is in a falling knife state on the monthly chart, with a confidence level of 78%. Key support is at $8.80 and key resistance at $12.0. Monthly selloff accelerated with consecutive large red candles and rising volume; price at ~$9.03 is far below the falling EMA50/EMA20 and prior base support; RSI (~28.8) is oversold.
Continuation lower (capitulation then brief bounce): price likely probes below the current pivot low, then attempts a dead-cat bounce back into the $10-$12 supply zone; trend remains bearish unless a higher low forms.
Oversold relief + base attempt: price holds $8.80-$8.00, forms a swing low/high reference, then grinds back to test the broken support near the falling MAs (EMA50/EMA20 zone).
Monthly close below $8.80 (new breakdown from the current pivot zone) confirms continued knife behavior
Monthly close back above $12.00 (reclaim prior breakdown area and hold) would invalidate the immediate falling-knife read
Scale-in only near/under the current swing-low support ($8.8 area) and deeper Fibonacci-style retracement zones; avoid size until a monthly higher low or reclaim of $12 forms.
Trim into major overhead supply where prior breakdown occurred and where the long-term impulse topped; those zones likely align with reclaimed moving averages and Fib retracement resistance.
As of March 26, 2026, OWL (Blue Owl Capital Inc.) is in a falling knife state on the monthly chart with 78% confidence. Monthly selloff accelerated with consecutive large red candles and rising volume; price at ~$9.03 is far below the falling EMA50/EMA20 and prior base support; RSI (~28.8) is oversold.
On the monthly timeframe, OWL has key support at $8.80 and key resistance at $12.0. The most likely scenario (bearish) targets $8.00 and $6.50, with a revert level at $10.6.
OWL (Blue Owl Capital Inc.) is currently classified as falling knife on the monthly chart, with 78% confidence. Confirmation requires: Monthly close below $8.80 (new breakdown from the current pivot zone) confirms continued knife behavior This would be invalidated by: Monthly close back above $12.00 (reclaim prior breakdown area and hold) would invalidate the immediate falling-knife read
The most likely scenario (bearish) targets $8.00 and $6.50, with a revert level at $10.6. The alternative scenario (bullish) targets $12.0 and $15.0.
Multi-layer AI agents analyse 200+ stocks across daily, weekly, and monthly timeframes — producing market state classifications, price scenarios with targets, and position entry/exit levels. Updated every trading day after market close. No paywall. No sign-up required.
Built by Foliotrail.
All content on this website — including charts, analysis, price targets, support/resistance levels, and position zones — is generated entirely by AI and provided for educational and informational purposes only.
This is not financial advice. NEXUSNOIR VENTURES SL (the operator of this website) is not a registered investment adviser or broker-dealer. You should not make investment decisions based solely on this information. Always do your own research and consult a qualified financial advisor.
By continuing, you acknowledge that you have read and agree to our full disclaimer & terms of use and privacy policy.