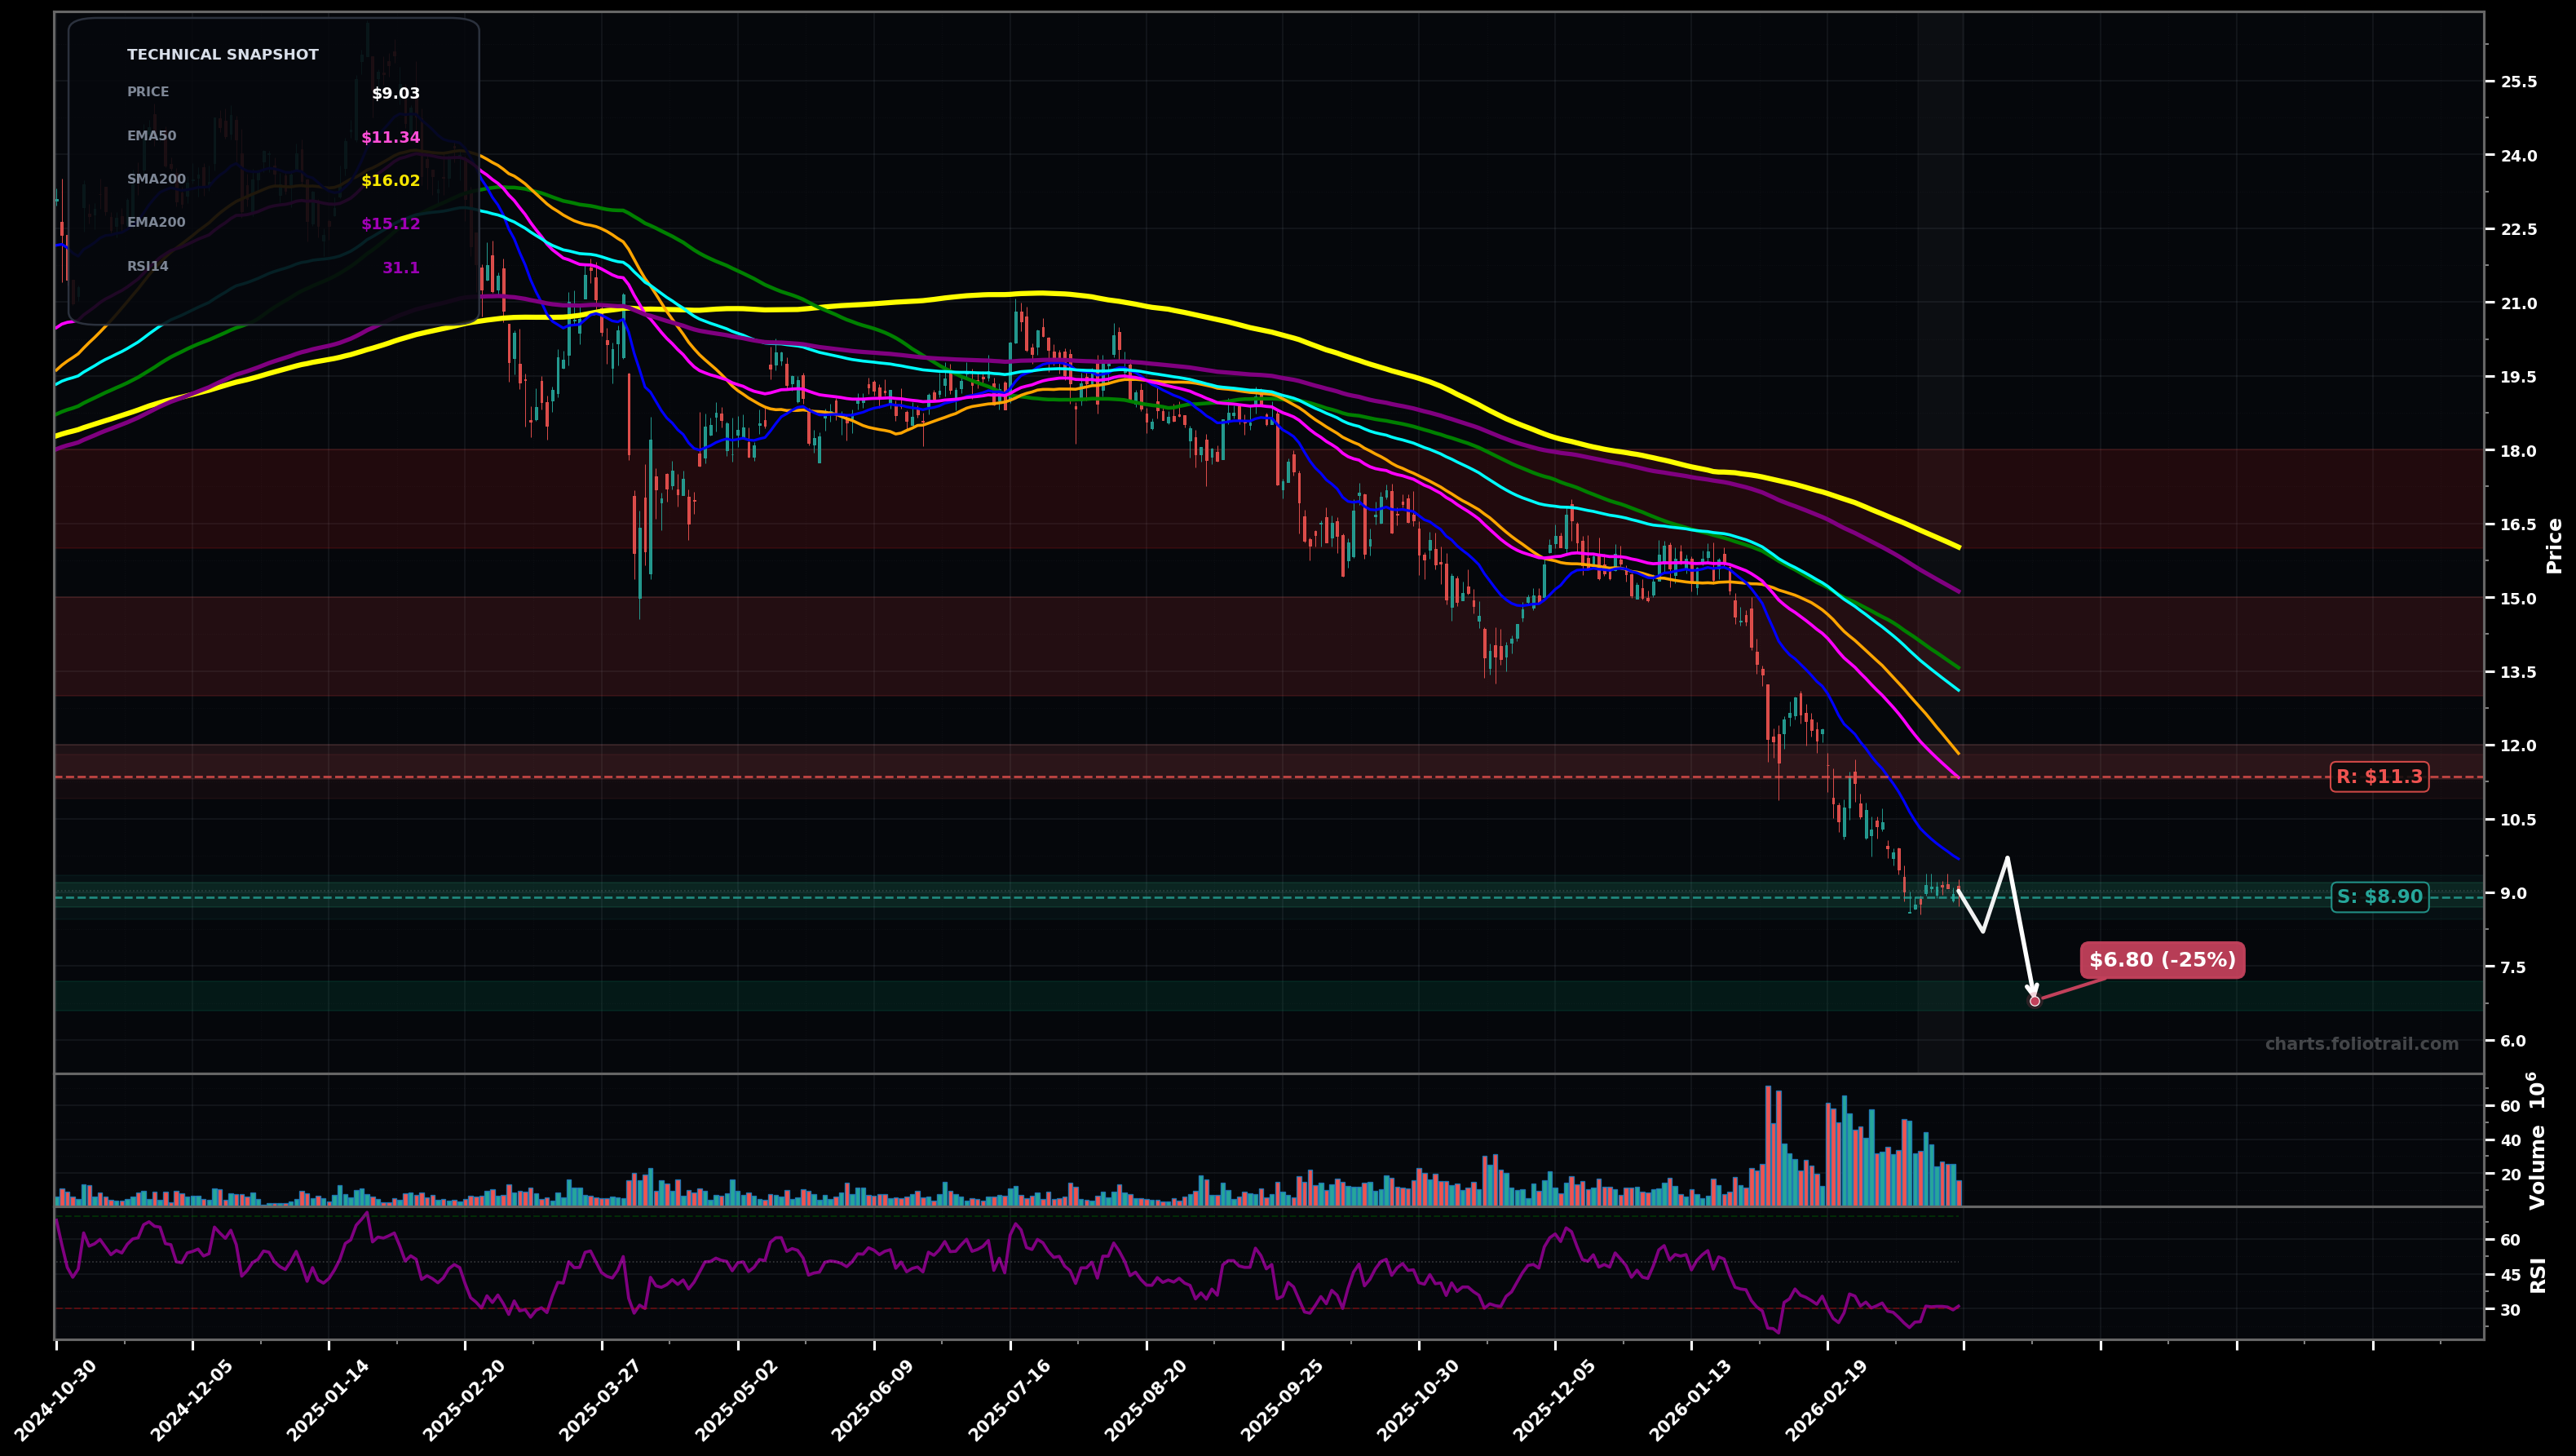
As of March 26, 2026, OWL (Blue Owl Capital Inc.) is in a falling knife state on the daily chart, with a confidence level of 74%. Key support is at $8.90 and key resistance at $11.3. Price at ~$9.03 continues to print a tight consolidation after a steep selloff; still below all key EMAs/SMAs with RSI ~31 (weak bounce attempts)
Bear flag / base-then-break: consolidation fails and price makes another LL, then attempts a reflex bounce from the next demand zone
Oversold bottoming attempt: price holds the recent swing low and grinds higher into the first moving-average cluster (mean reversion rally) before sellers reappear
Break and daily close below $8.90 (new LL) would confirm continued falling-knife pressure
Two daily closes back above $11.35 (EMA50) would invalidate falling-knife and shift toward a bottoming attempt
Start near current swing-low support; add on confirmed flush into next demand; heavy add only on capitulation-style extension where risk/reward improves materially.
Trim into mean-reversion back to EMA50 then EMA100/major prior breakdown area; close into larger overhead supply near SMA200 (~$16) where downtrend rallies often fail.
As of March 26, 2026, OWL (Blue Owl Capital Inc.) is in a falling knife state on the daily chart with 74% confidence. Price at ~$9.03 continues to print a tight consolidation after a steep selloff; still below all key EMAs/SMAs with RSI ~31 (weak bounce attempts)
On the daily timeframe, OWL has key support at $8.90 and key resistance at $11.3. The most likely scenario (bearish) targets $8.20 and $6.80, with a revert level at $9.70.
OWL (Blue Owl Capital Inc.) is currently classified as falling knife on the daily chart, with 74% confidence. Confirmation requires: Break and daily close below $8.90 (new LL) would confirm continued falling-knife pressure This would be invalidated by: Two daily closes back above $11.35 (EMA50) would invalidate falling-knife and shift toward a bottoming attempt
The most likely scenario (bearish) targets $8.20 and $6.80, with a revert level at $9.70. The alternative scenario (bullish) targets $10.5 and $11.3.
Multi-layer AI agents analyse 200+ stocks across daily, weekly, and monthly timeframes — producing market state classifications, price scenarios with targets, and position entry/exit levels. Updated every trading day after market close. No paywall. No sign-up required.
Built by Foliotrail.
All content on this website — including charts, analysis, price targets, support/resistance levels, and position zones — is generated entirely by AI and provided for educational and informational purposes only.
This is not financial advice. NEXUSNOIR VENTURES SL (the operator of this website) is not a registered investment adviser or broker-dealer. You should not make investment decisions based solely on this information. Always do your own research and consult a qualified financial advisor.
By continuing, you acknowledge that you have read and agree to our full disclaimer & terms of use and privacy policy.