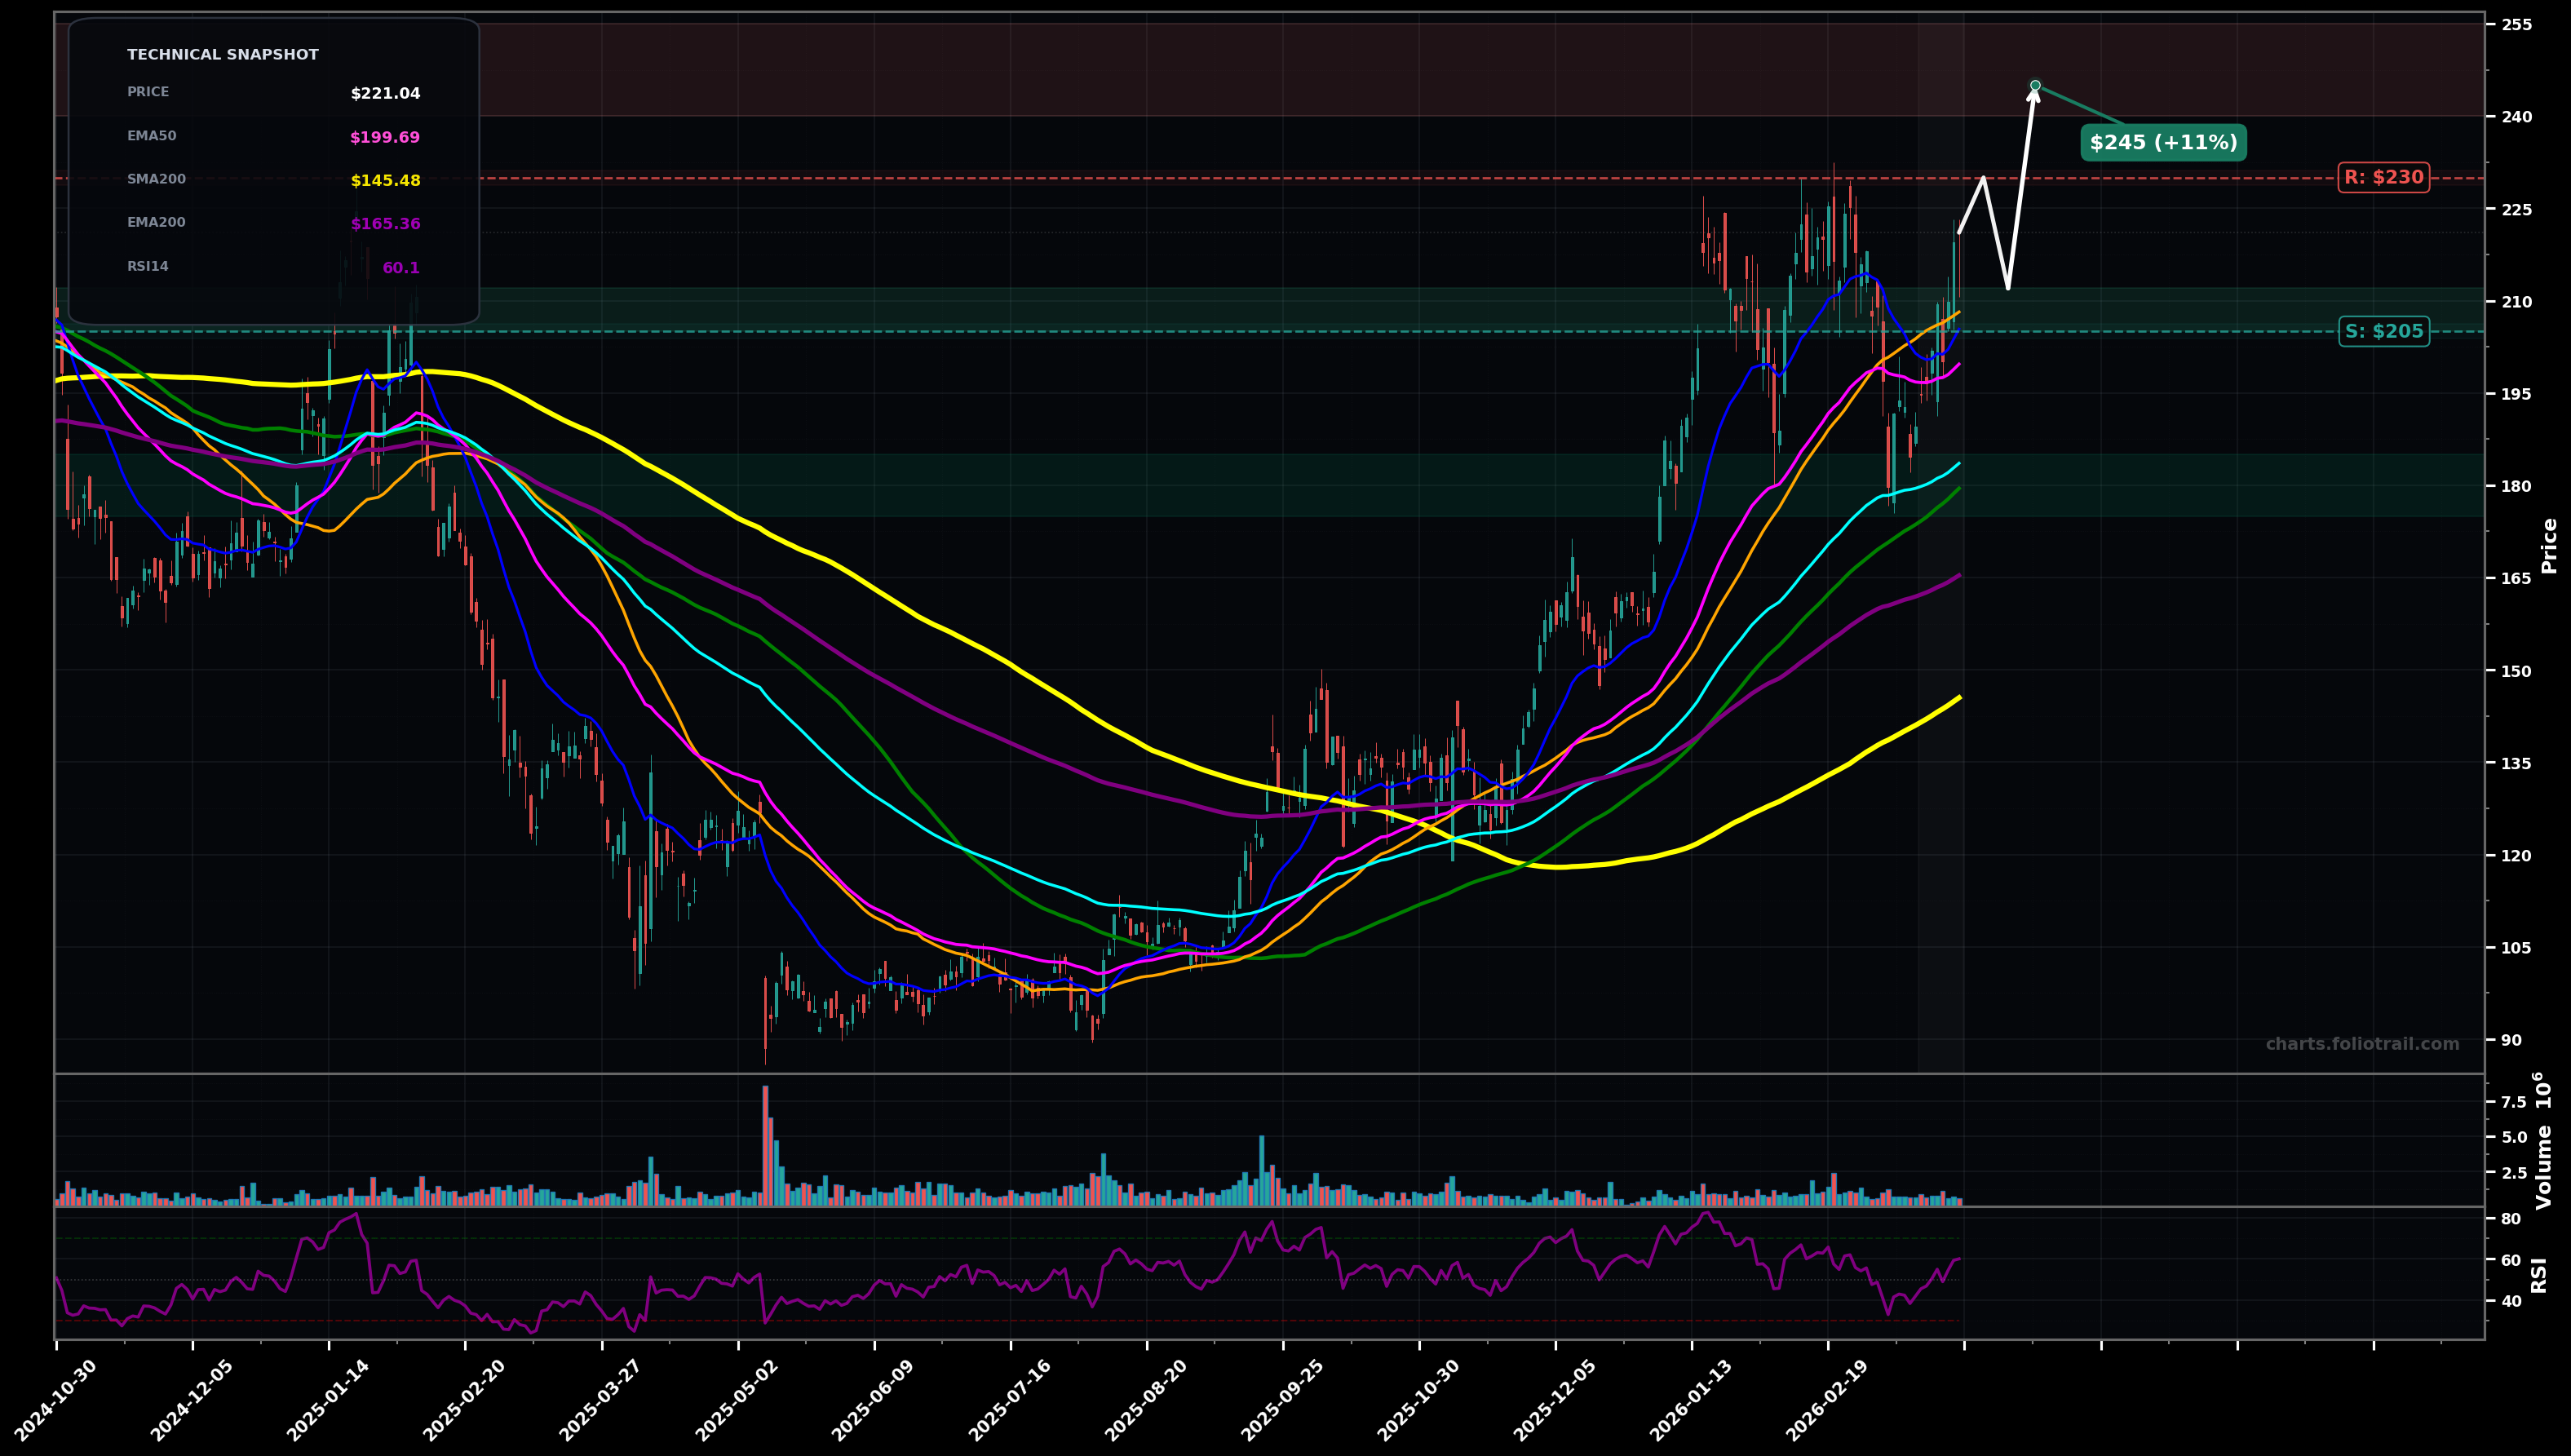
As of March 26, 2026, ONTO (Onto Innovation Inc.) is in a uptrend state on the daily chart, with a confidence level of 68%. Key support is at $205 and key resistance at $230. Price at ~$221 has rebounded from the Feb pullback and is holding above the clustered fast/mid MAs (SMA50/EMA50 area), while prior highs near ~$230 remain the overhead cap; RSI ~60 suggests renewed momentum without being extreme.
Bullish continuation: consolidation/pause above the $205–$210 MA cluster, then a breakout through $230 to new highs (typical wave-5 extension attempt if this is late-cycle impulse).
Deeper pullback within the uptrend: rejection at $230 followed by a drop into the mid-MA stack (EMA100/SMA100 area) before buyers reassert; would fit an Elliott Wave wave-4 style correction before another push.
2+ daily closes above $230 (clean break of the prior swing high)
Daily close below $205 (loss of the SMA50/EMA50 support cluster and recent swing structure)
Start near the rising SMA50/EMA50 support; add on a controlled breakdown to EMA100/SMA100; heavy add only at the larger trend support near the ~$180 region where prior demand and MA confluence is stronger.
Trim into strength as price becomes increasingly stretched above the rising MA stack; heavier trimming/exit reserved for an extended upside run that would likely be far above EMA50/100 and prone to mean reversion.
As of March 26, 2026, ONTO (Onto Innovation Inc.) is in a uptrend state on the daily chart with 68% confidence. Price at ~$221 has rebounded from the Feb pullback and is holding above the clustered fast/mid MAs (SMA50/EMA50 area), while prior highs near ~$230 remain the overhead cap; RSI ~60 suggests renewed momentum without being extreme.
On the daily timeframe, ONTO has key support at $205 and key resistance at $230. The most likely scenario (bullish) targets $230 and $245, with a revert level at $212.
ONTO (Onto Innovation Inc.) is currently classified as uptrend on the daily chart, with 68% confidence. Confirmation requires: 2+ daily closes above $230 (clean break of the prior swing high) This would be invalidated by: Daily close below $205 (loss of the SMA50/EMA50 support cluster and recent swing structure)
The most likely scenario (bullish) targets $230 and $245, with a revert level at $212. The alternative scenario (bearish) targets $200 and $180.
Multi-layer AI agents analyse 200+ stocks across daily, weekly, and monthly timeframes — producing market state classifications, price scenarios with targets, and position entry/exit levels. Updated every trading day after market close. No paywall. No sign-up required.
Built by Foliotrail.
All content on this website — including charts, analysis, price targets, support/resistance levels, and position zones — is generated entirely by AI and provided for educational and informational purposes only.
This is not financial advice. NEXUSNOIR VENTURES SL (the operator of this website) is not a registered investment adviser or broker-dealer. You should not make investment decisions based solely on this information. Always do your own research and consult a qualified financial advisor.
By continuing, you acknowledge that you have read and agree to our full disclaimer & terms of use and privacy policy.