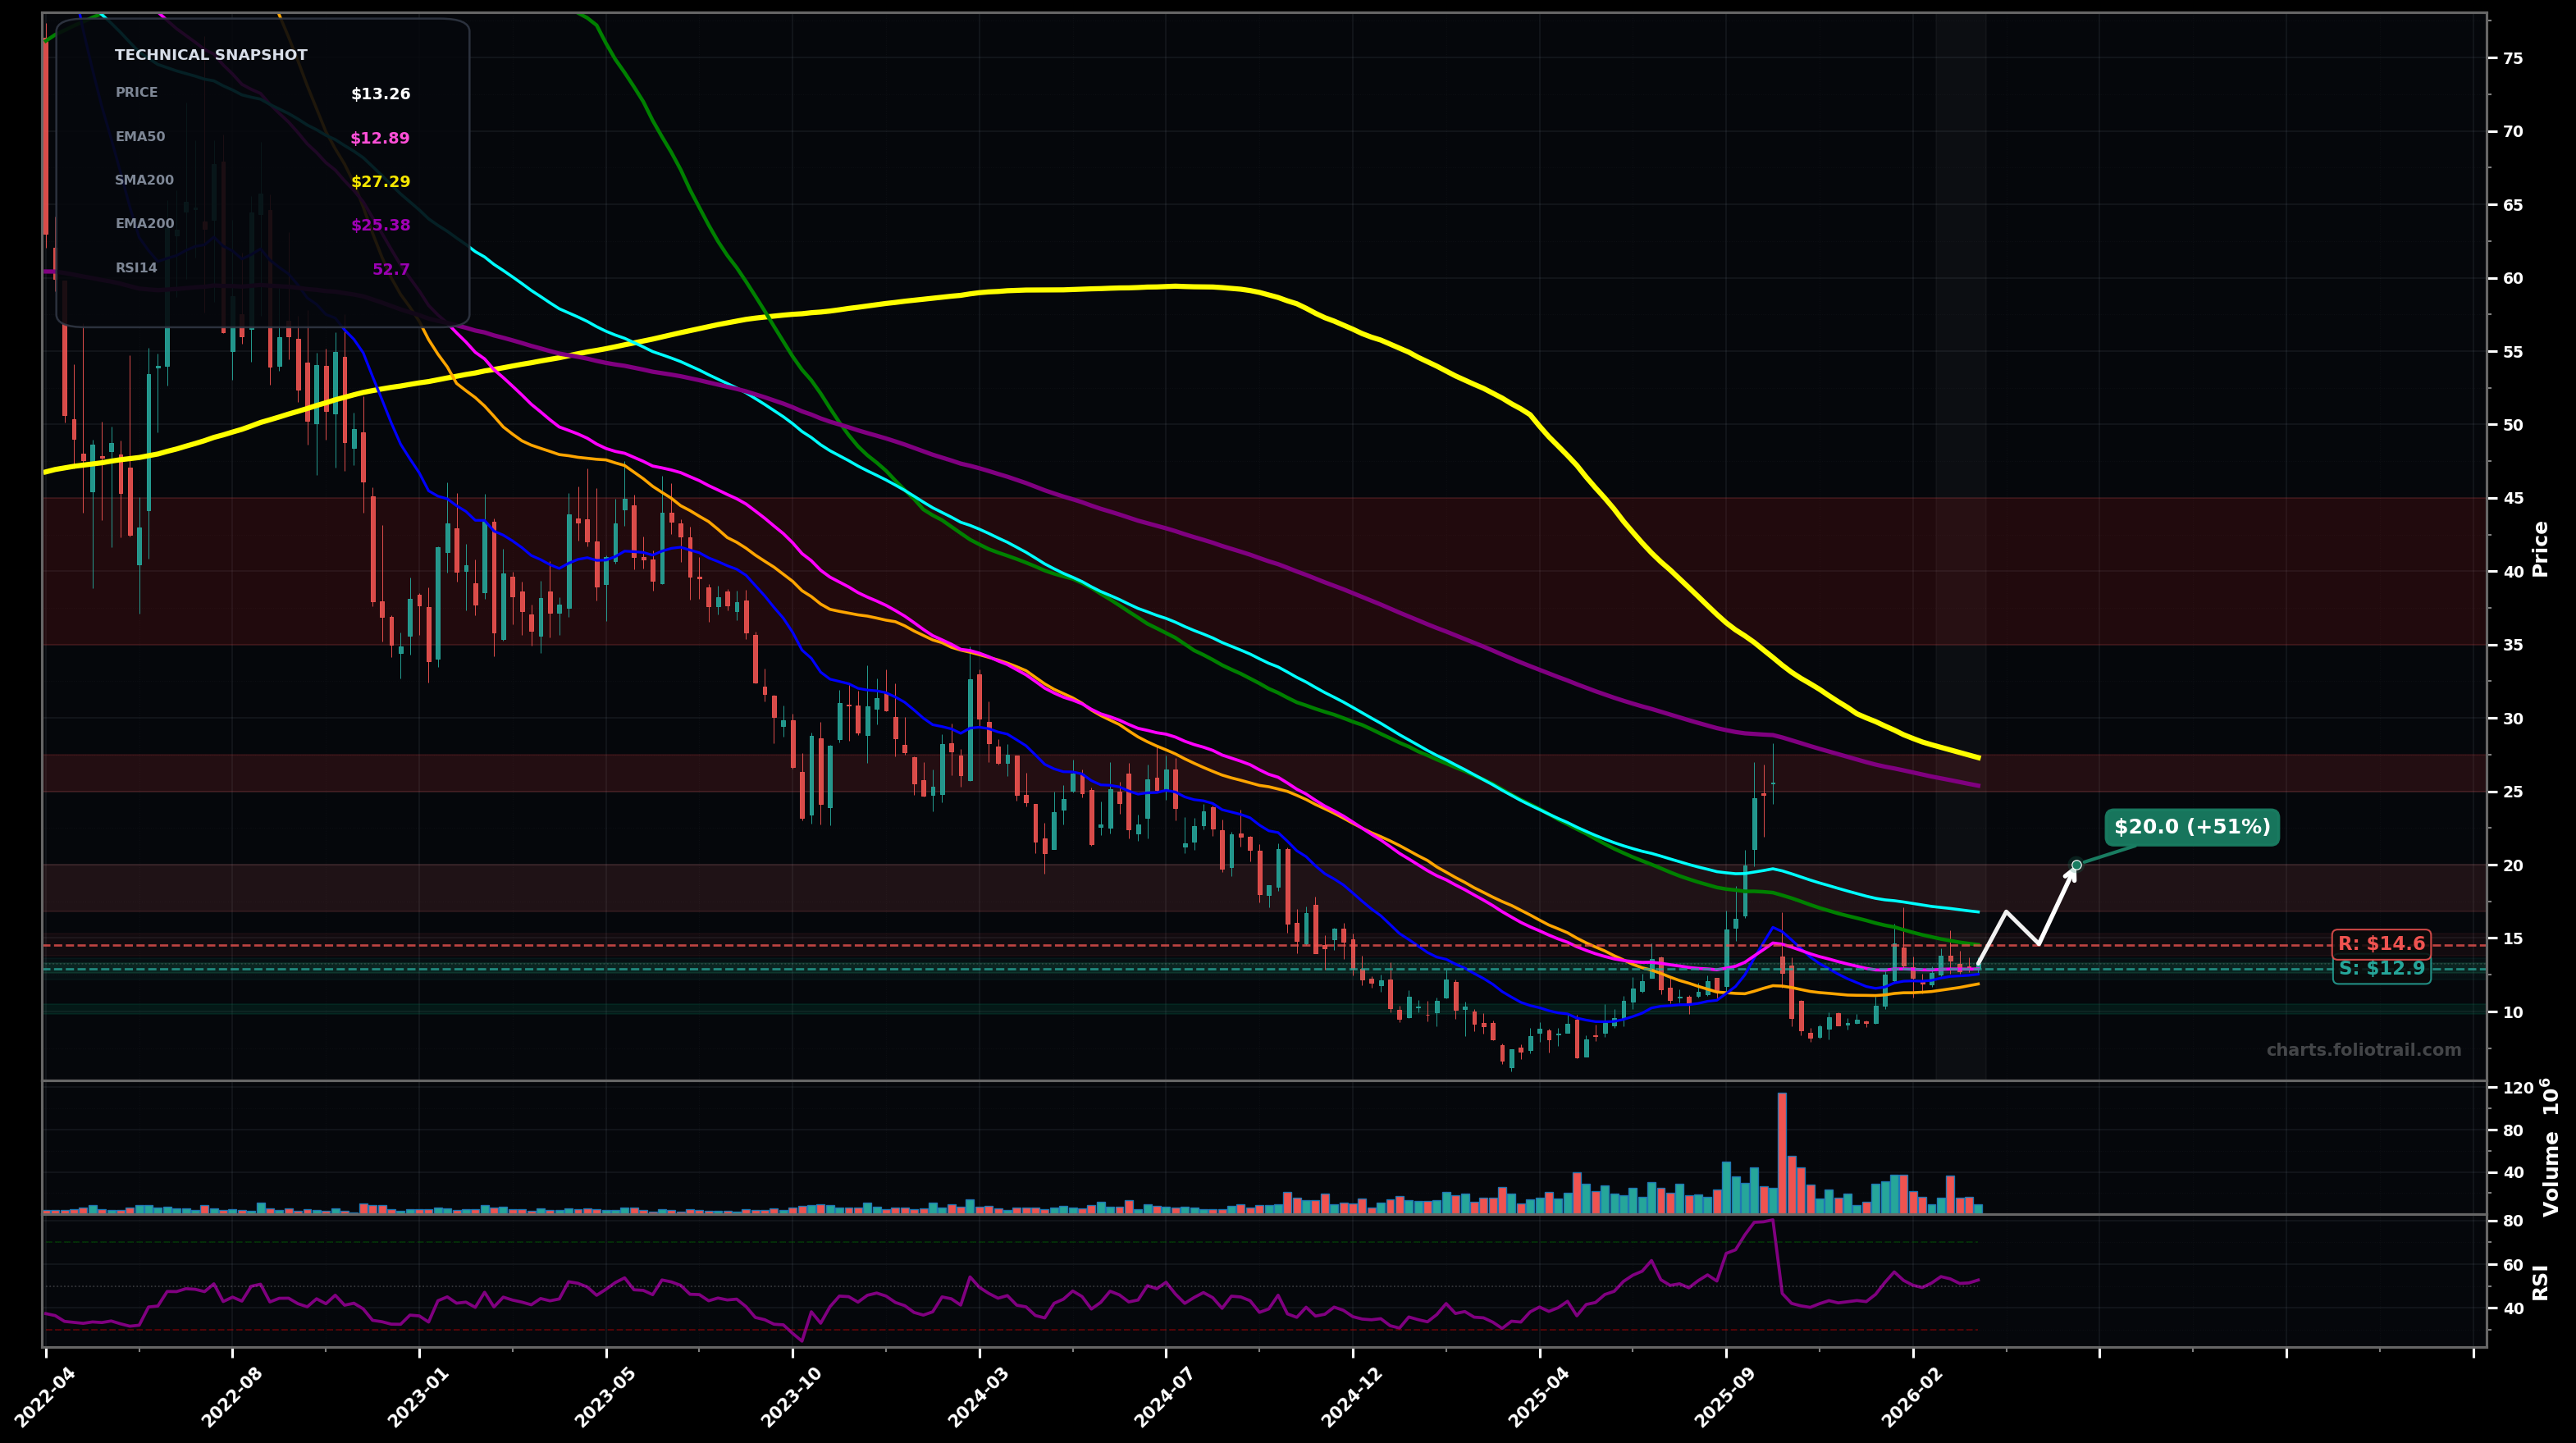
As of March 26, 2026, NTLA (Intellia Therapeutics Inc.) is in a bottoming attempt state on the weekly chart, with a confidence level of 63%. Key support is at $12.9 and key resistance at $14.6. Weekly NTLA is consolidating around $13.26 with RSI ~52.7; price is hovering near/just above the fast MAs (SMA50 ~$11.87, EMA50 ~$12.89) but remains well below EMA100 (~$16.78) and EMA200 (~$25.38).
Base resolves upward: grind higher through $14.55, then a pullback/retest holds $14–$15 before pushing into the EMA100 supply zone.
Range failure: price rejects at $14.55–$16.80 and rolls back into the base, revisiting the prior swing-low area; a deeper flush tests psychological support.
Weekly close(s) holding above $14.55 (SMA100) with follow-through toward $16.78 (EMA100).
Weekly close below $11.87 (SMA50) followed by loss of $10.00 support.
Start near EMA50/support confluence (~$12.9); add on pullbacks to SMA50/structure; heavy add only on capitulation-style retest of the base lows near $10.
Trim into EMA100 resistance first, then major supply at EMA200/SMA200 zone (~mid-$20s); full exit only if a multi-year mean-reversion overshoot toward prior heavy overhead supply ($35+).
As of March 26, 2026, NTLA (Intellia Therapeutics Inc.) is in a bottoming attempt state on the weekly chart with 63% confidence. Weekly NTLA is consolidating around $13.26 with RSI ~52.7; price is hovering near/just above the fast MAs (SMA50 ~$11.87, EMA50 ~$12.89) but remains well below EMA100 (~$16.78) and EMA200 (~$25.38).
On the weekly timeframe, NTLA has key support at $12.9 and key resistance at $14.6. The most likely scenario (bullish) targets $16.8 and $20.0, with a revert level at $14.6.
NTLA (Intellia Therapeutics Inc.) is currently classified as bottoming attempt on the weekly chart, with 63% confidence. Confirmation requires: Weekly close(s) holding above $14.55 (SMA100) with follow-through toward $16.78 (EMA100). This would be invalidated by: Weekly close below $11.87 (SMA50) followed by loss of $10.00 support.
The most likely scenario (bullish) targets $16.8 and $20.0, with a revert level at $14.6. The alternative scenario (bearish) targets $11.9 and $10.0.
Multi-layer AI agents analyse 200+ stocks across daily, weekly, and monthly timeframes — producing market state classifications, price scenarios with targets, and position entry/exit levels. Updated every trading day after market close. No paywall. No sign-up required.
Built by Foliotrail.
All content on this website — including charts, analysis, price targets, support/resistance levels, and position zones — is generated entirely by AI and provided for educational and informational purposes only.
This is not financial advice. NEXUSNOIR VENTURES SL (the operator of this website) is not a registered investment adviser or broker-dealer. You should not make investment decisions based solely on this information. Always do your own research and consult a qualified financial advisor.
By continuing, you acknowledge that you have read and agree to our full disclaimer & terms of use and privacy policy.