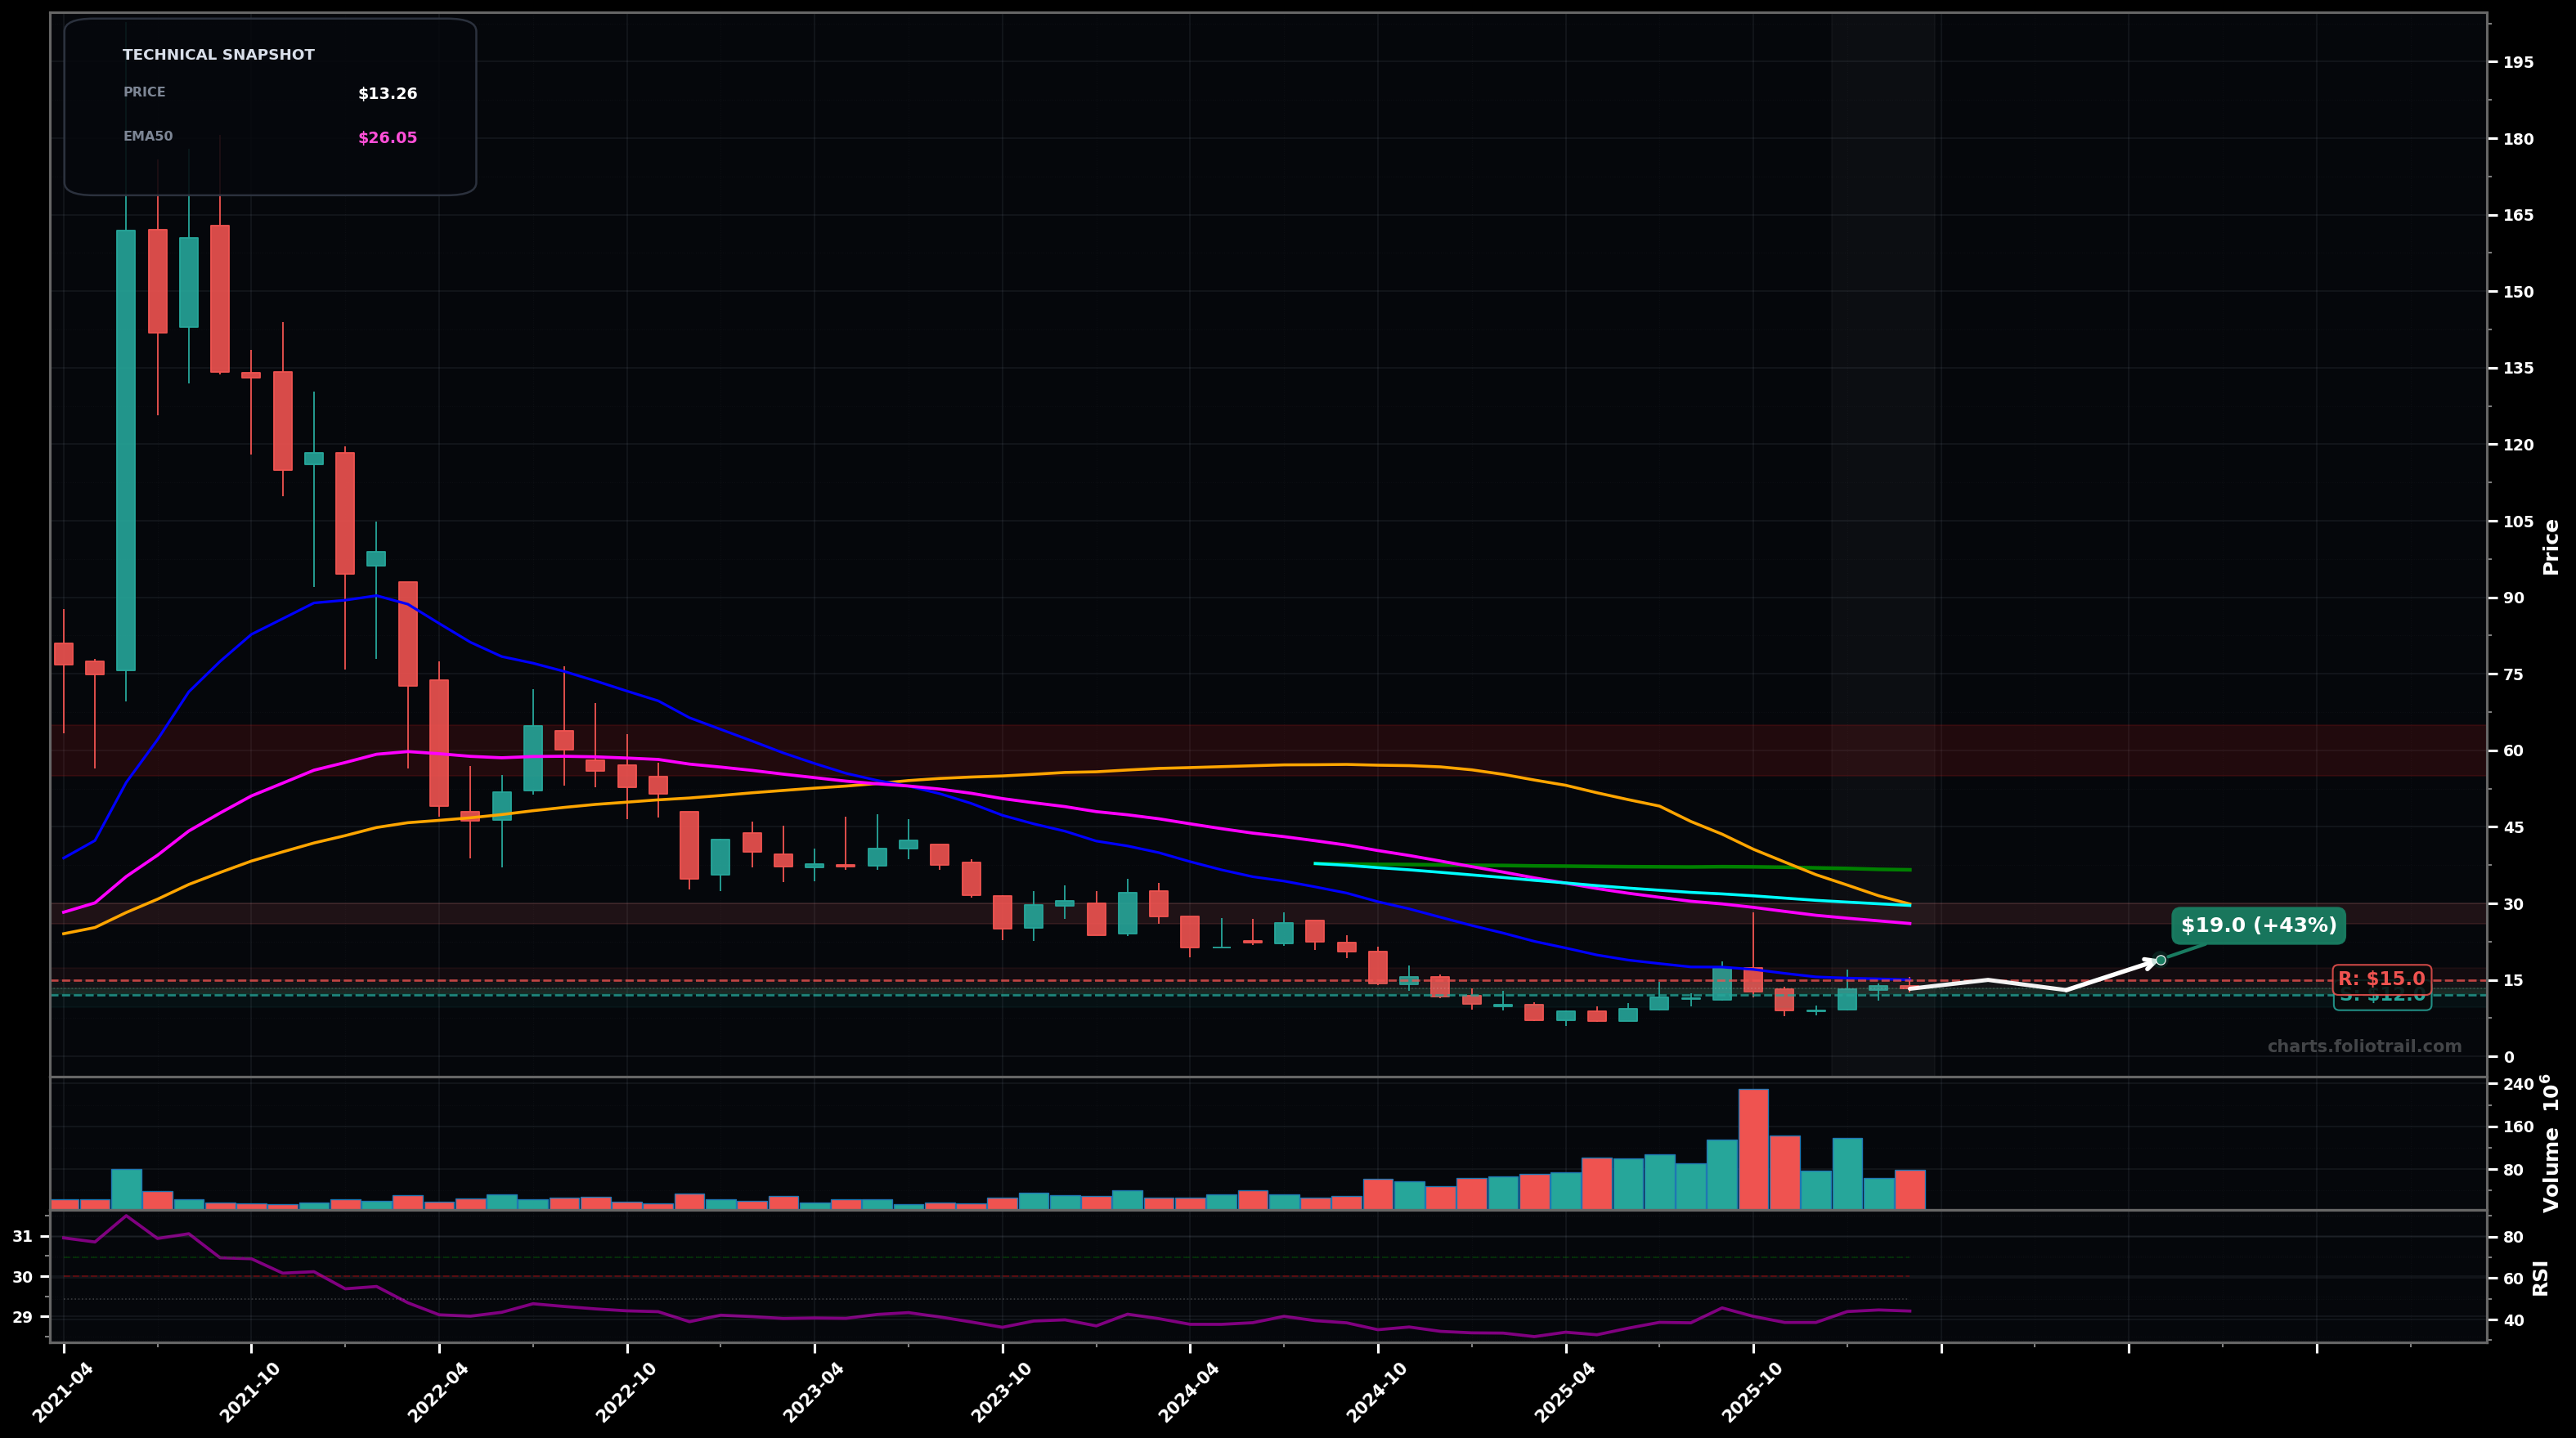
As of March 26, 2026, NTLA (Intellia Therapeutics Inc.) is in a bottoming attempt state on the monthly chart, with a confidence level of 62%. Key support is at $12.0 and key resistance at $15.0. Monthly downtrend with price basing near lows; small rebound attempts but still below major MAs (EMA50/100 and SMA50/100/200).
Base continues: price holds $12 support, grinds higher into prior supply; wave-count view: a developing ABC corrective rally (or Wave (2)) that struggles under the EMA20/overhead pivots before a bigger trend decision.
Breakdown continuation: failure to reclaim $15 leads to a rollover and new low; Elliott view: extension of the larger impulse down (late Wave (3)/(5)) with capitulation risk on heavy volume.
2+ monthly closes above $26 (EMA50 pink) would confirm a breakout-reversal attempt
Monthly close below $12.00 would invalidate the bottoming attempt and re-open a falling-knife continuation
Accumulation bias only near the swing-low support region ($12) and lower fib-extension risk zones; trend remains bearish below EMA50/EMA100 so size should scale in on weakness.
Overhead MA cluster/resistance: first trim near EMA50/EMA100 reclaim zone, heavier trim near SMA100 (~$36.6) and prior distribution, full exit into a larger mean-reversion overshoot toward prior multi-year resistance.
As of March 26, 2026, NTLA (Intellia Therapeutics Inc.) is in a bottoming attempt state on the monthly chart with 62% confidence. Monthly downtrend with price basing near lows; small rebound attempts but still below major MAs (EMA50/100 and SMA50/100/200).
On the monthly timeframe, NTLA has key support at $12.0 and key resistance at $15.0. The most likely scenario (bullish) targets $15.0 and $19.0, with a revert level at $13.0.
NTLA (Intellia Therapeutics Inc.) is currently classified as bottoming attempt on the monthly chart, with 62% confidence. Confirmation requires: 2+ monthly closes above $26 (EMA50 pink) would confirm a breakout-reversal attempt This would be invalidated by: Monthly close below $12.00 would invalidate the bottoming attempt and re-open a falling-knife continuation
The most likely scenario (bullish) targets $15.0 and $19.0, with a revert level at $13.0. The alternative scenario (bearish) targets $11.0 and $8.50.
Multi-layer AI agents analyse 200+ stocks across daily, weekly, and monthly timeframes — producing market state classifications, price scenarios with targets, and position entry/exit levels. Updated every trading day after market close. No paywall. No sign-up required.
Built by Foliotrail.
All content on this website — including charts, analysis, price targets, support/resistance levels, and position zones — is generated entirely by AI and provided for educational and informational purposes only.
This is not financial advice. NEXUSNOIR VENTURES SL (the operator of this website) is not a registered investment adviser or broker-dealer. You should not make investment decisions based solely on this information. Always do your own research and consult a qualified financial advisor.
By continuing, you acknowledge that you have read and agree to our full disclaimer & terms of use and privacy policy.