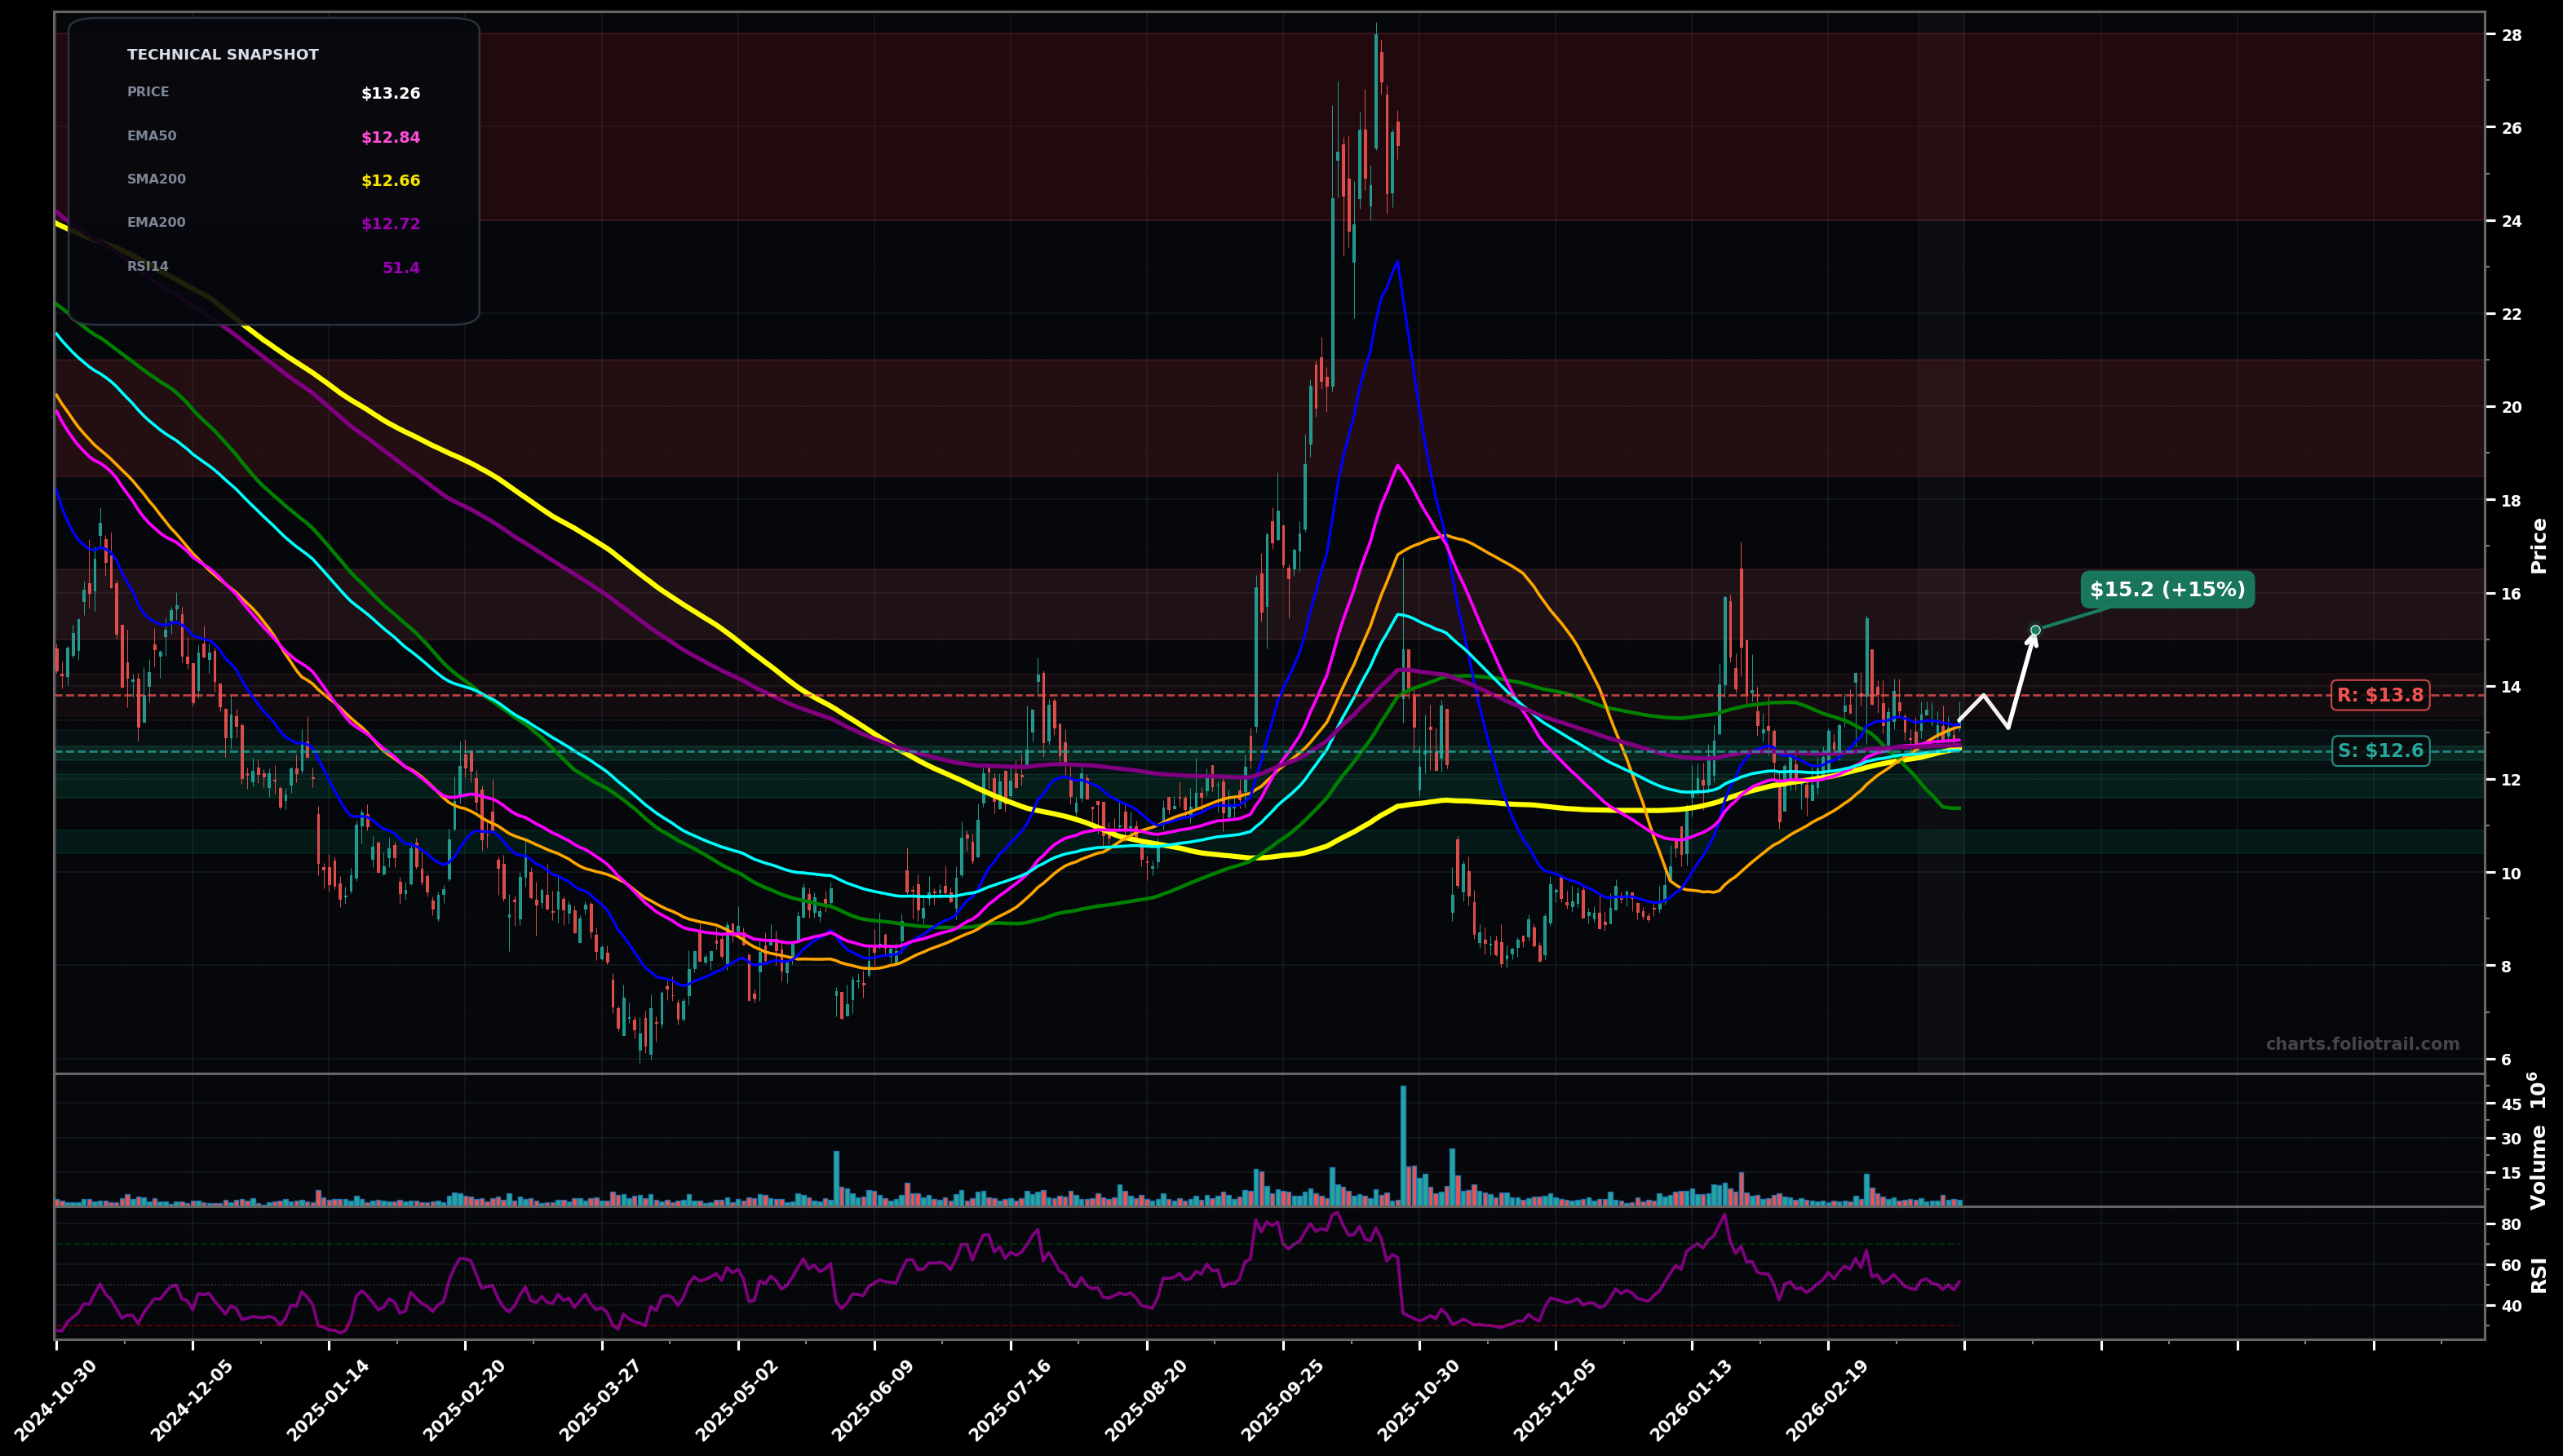
As of March 26, 2026, NTLA (Intellia Therapeutics Inc.) is in a choppy range state on the daily chart, with a confidence level of 66%. Key support is at $12.6 and key resistance at $13.8. Price is compressing around clustered MAs near $13 after a post-spike selloff and multi-month sideways range; momentum neutral (RSI ~51).
Range continues: price holds the $12.60 area (SMA200/EMA100/EMA200 zone) and grinds upward to test $13.80, with a potential breakout retest before a push toward the next supply band.
Bearish resolution: failure at $13.80 followed by a breakdown under $12.60 leads to a liquidity sweep of the range lows and a move back toward the prior base area.
2+ daily closes above $13.80 (holding above the MA cluster) would confirm a range-break attempt
Daily close below $12.20 (loss of the cluster/support) would invalidate the neutral range thesis toward bearish control
Start near the MA-cluster/swing support (~$12.6); add on confirmed breakdown-retest into prior range floor; heavy add only near deeper base support where sellers previously exhausted.
Trim into prior supply zones from the post-spike distribution (likely Fib retrace/resistance bands); full exit if price revisits extreme blow-off area where upside becomes highly convex and reversal risk rises.
As of March 26, 2026, NTLA (Intellia Therapeutics Inc.) is in a choppy range state on the daily chart with 66% confidence. Price is compressing around clustered MAs near $13 after a post-spike selloff and multi-month sideways range; momentum neutral (RSI ~51).
On the daily timeframe, NTLA has key support at $12.6 and key resistance at $13.8. The most likely scenario (bullish) targets $13.8 and $15.2, with a revert level at $13.1.
NTLA (Intellia Therapeutics Inc.) is currently classified as choppy range on the daily chart, with 66% confidence. Confirmation requires: 2+ daily closes above $13.80 (holding above the MA cluster) would confirm a range-break attempt This would be invalidated by: Daily close below $12.20 (loss of the cluster/support) would invalidate the neutral range thesis toward bearish control
The most likely scenario (bullish) targets $13.8 and $15.2, with a revert level at $13.1. The alternative scenario (bearish) targets $12.2 and $10.8.
Multi-layer AI agents analyse 200+ stocks across daily, weekly, and monthly timeframes — producing market state classifications, price scenarios with targets, and position entry/exit levels. Updated every trading day after market close. No paywall. No sign-up required.
Built by Foliotrail.
All content on this website — including charts, analysis, price targets, support/resistance levels, and position zones — is generated entirely by AI and provided for educational and informational purposes only.
This is not financial advice. NEXUSNOIR VENTURES SL (the operator of this website) is not a registered investment adviser or broker-dealer. You should not make investment decisions based solely on this information. Always do your own research and consult a qualified financial advisor.
By continuing, you acknowledge that you have read and agree to our full disclaimer & terms of use and privacy policy.