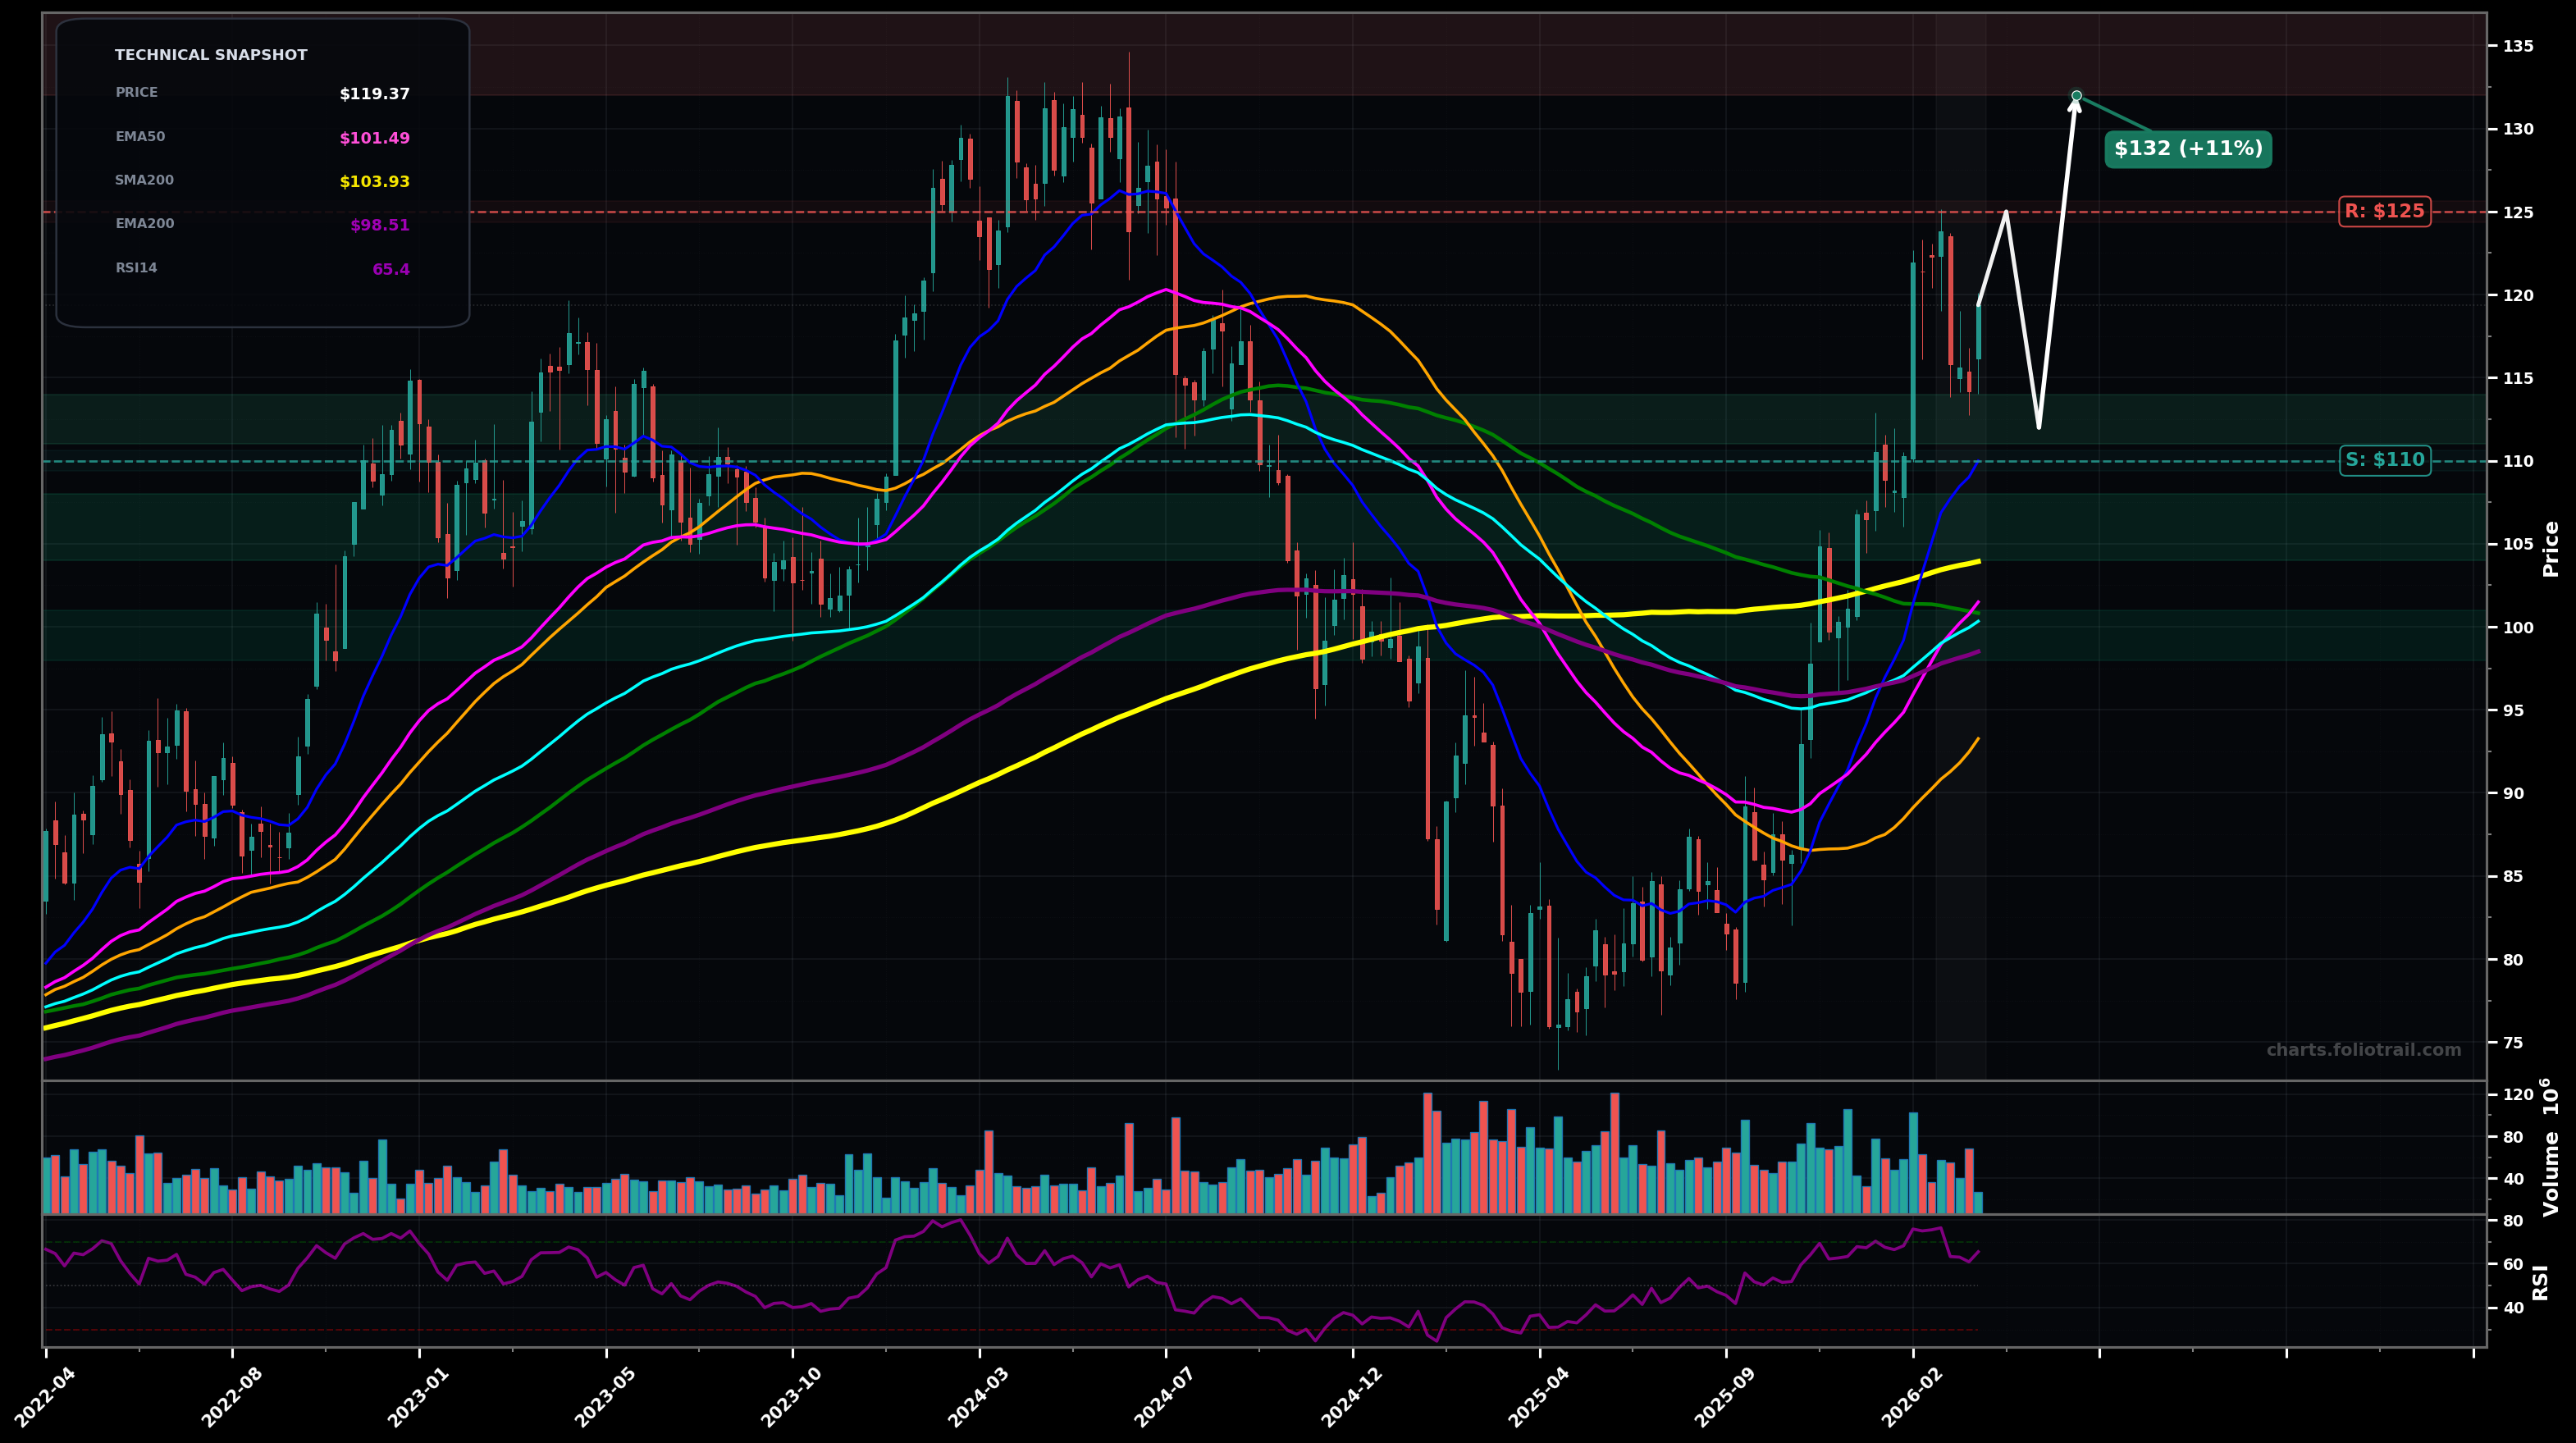
As of March 26, 2026, MRK (Merck & Co., Inc.) is in a uptrend state on the weekly chart, with a confidence level of 68%. Key support is at $110 and key resistance at $125. Sharp rebound from the $80s base; price now ~$119 and consolidating below the prior supply zone after a strong impulsive leg up; RSI ~65 (momentum positive).
Bullish continuation: pullback holds above $110–$112 (prior breakout area) then retests the $125 supply; breakout leads to a measured push toward the prior distribution zone.
Bearish/mean-reversion: rejection at $125 forms an LH and price rotates back into the MA band (EMA50/100 + SMA200). If $110 breaks, deeper retrace toward the larger base breakout zone.
Weekly close above $125 (break/hold above the recent swing-high supply zone).
Weekly close below $110 (loss of the most recent swing-low support and slip back into the MA cluster).
$111–$114 = prior breakout retest; $104–$108 = confluence with SMA200/structure; $98–$101 = EMA200 + deeper Fib retrace into the post-base demand zone.
Trim into prior weekly supply and Fib extensions: $132–$138 (initial extension), $145–$155 (larger extension/likely wave-5 stretch), $160–$175 (overshoot risk vs long-term MAs).
As of March 26, 2026, MRK (Merck & Co., Inc.) is in a uptrend state on the weekly chart with 68% confidence. Sharp rebound from the $80s base; price now ~$119 and consolidating below the prior supply zone after a strong impulsive leg up; RSI ~65 (momentum positive).
On the weekly timeframe, MRK has key support at $110 and key resistance at $125. The most likely scenario (bullish) targets $125 and $132, with a revert level at $112.
MRK (Merck & Co., Inc.) is currently classified as uptrend on the weekly chart, with 68% confidence. Confirmation requires: Weekly close above $125 (break/hold above the recent swing-high supply zone). This would be invalidated by: Weekly close below $110 (loss of the most recent swing-low support and slip back into the MA cluster).
The most likely scenario (bullish) targets $125 and $132, with a revert level at $112. The alternative scenario (bearish) targets $104 and $98.0.
Multi-layer AI agents analyse 200+ stocks across daily, weekly, and monthly timeframes — producing market state classifications, price scenarios with targets, and position entry/exit levels. Updated every trading day after market close. No paywall. No sign-up required.
Built by Foliotrail.
All content on this website — including charts, analysis, price targets, support/resistance levels, and position zones — is generated entirely by AI and provided for educational and informational purposes only.
This is not financial advice. NEXUSNOIR VENTURES SL (the operator of this website) is not a registered investment adviser or broker-dealer. You should not make investment decisions based solely on this information. Always do your own research and consult a qualified financial advisor.
By continuing, you acknowledge that you have read and agree to our full disclaimer & terms of use and privacy policy.