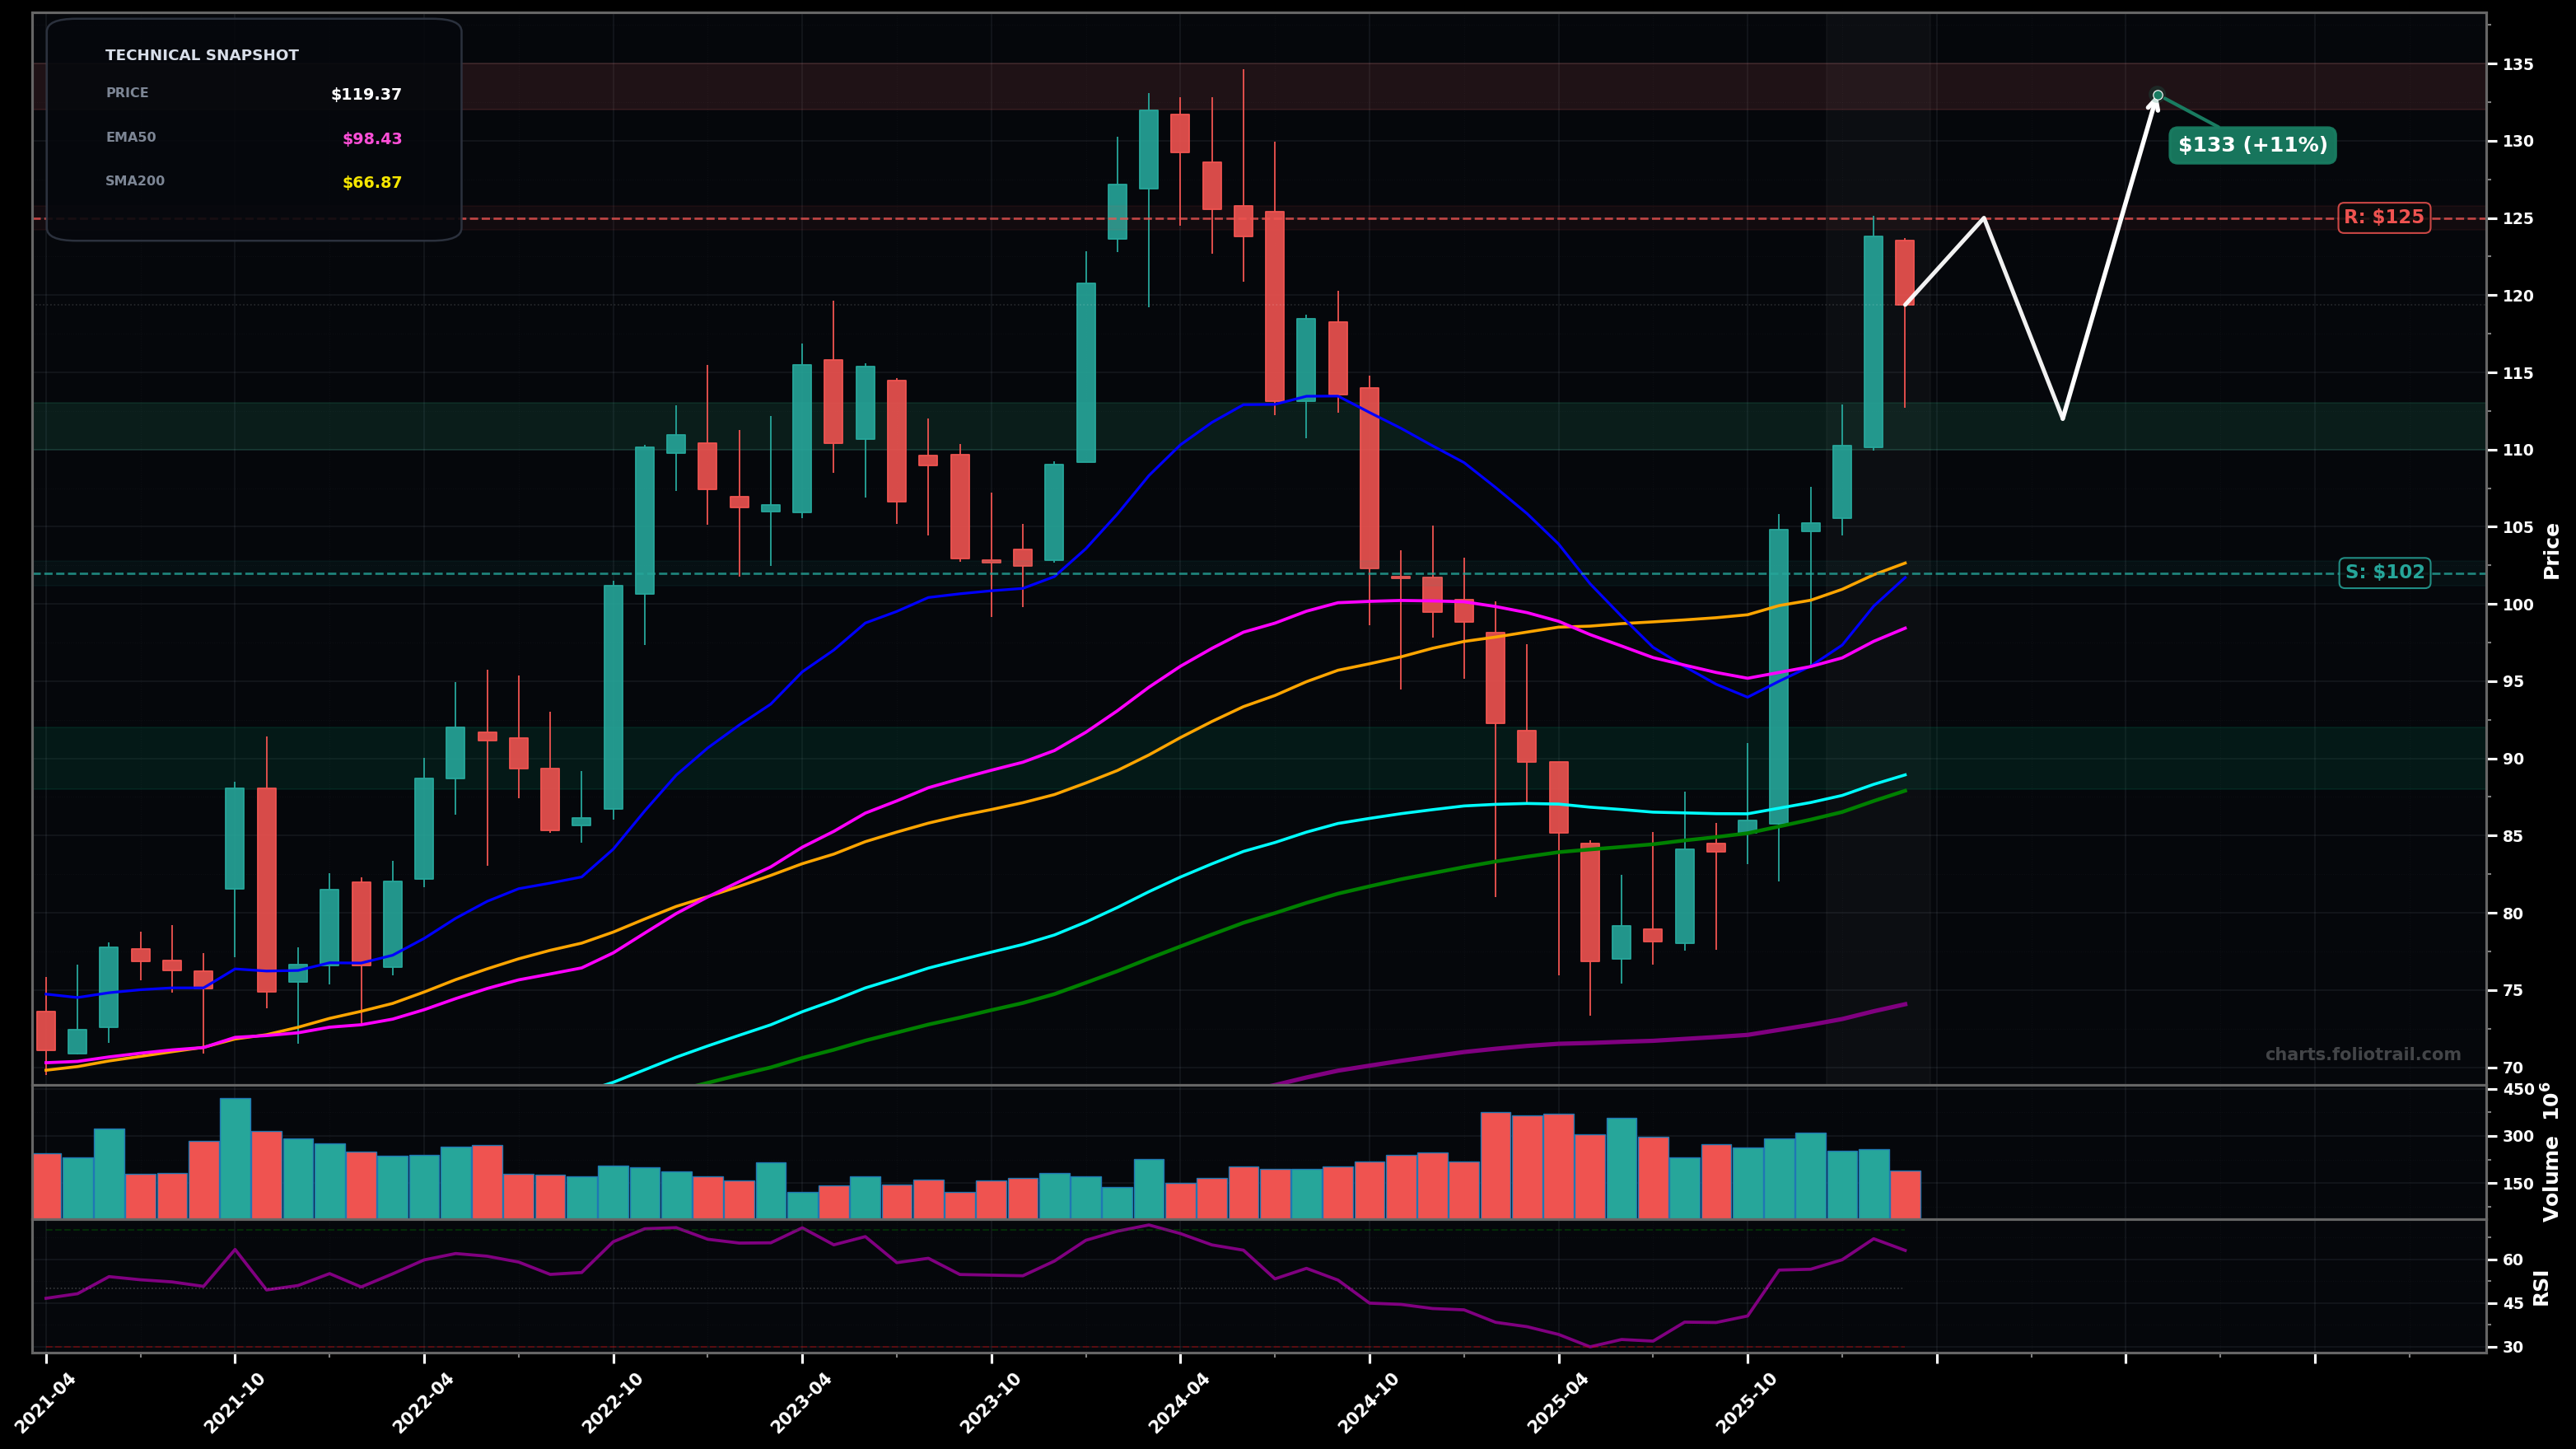
As of March 26, 2026, MRK (Merck & Co., Inc.) is in a breakout reversal state on the monthly chart, with a confidence level of 64%. Key support is at $102 and key resistance at $125. Strong rebound off ~$75–$80 base, impulsive rally to ~$125 followed by a pullback; price still above key MAs with RSI ~63.
Bullish continuation: pullback consolidates above $110–$112, then re-tests and breaks $125, aiming for prior supply near $132–$135 (Fib extension / prior swing zone).
Bearish retest: failure at $125 leads to a deeper mean-reversion toward the $102–$98 MA cluster (SMA50/EMA50), with risk of revisiting the ~$90 area (EMA100/SMA100) if momentum breaks.
Monthly close above $125 (and hold above $119 on the next month) would confirm continuation
Monthly close below $102 (SMA50 area) would invalidate the breakout-reversal and shift back to range/weakness
Start on orderly pullback above former breakout zone; add at SMA50/EMA50 confluence; heavy add near EMA100/SMA100 where the reversal thesis must defend.
Trim into prior swing supply ($132–$135) and likely Fib extension zones; heavier trims as price becomes increasingly stretched vs EMA50/100; full close only if a multi-year overextension develops.
As of March 26, 2026, MRK (Merck & Co., Inc.) is in a breakout reversal state on the monthly chart with 64% confidence. Strong rebound off ~$75–$80 base, impulsive rally to ~$125 followed by a pullback; price still above key MAs with RSI ~63.
On the monthly timeframe, MRK has key support at $102 and key resistance at $125. The most likely scenario (bullish) targets $125 and $133, with a revert level at $112.
MRK (Merck & Co., Inc.) is currently classified as breakout reversal on the monthly chart, with 64% confidence. Confirmation requires: Monthly close above $125 (and hold above $119 on the next month) would confirm continuation This would be invalidated by: Monthly close below $102 (SMA50 area) would invalidate the breakout-reversal and shift back to range/weakness
The most likely scenario (bullish) targets $125 and $133, with a revert level at $112. The alternative scenario (bearish) targets $102 and $90.0.
Multi-layer AI agents analyse 200+ stocks across daily, weekly, and monthly timeframes — producing market state classifications, price scenarios with targets, and position entry/exit levels. Updated every trading day after market close. No paywall. No sign-up required.
Built by Foliotrail.
All content on this website — including charts, analysis, price targets, support/resistance levels, and position zones — is generated entirely by AI and provided for educational and informational purposes only.
This is not financial advice. NEXUSNOIR VENTURES SL (the operator of this website) is not a registered investment adviser or broker-dealer. You should not make investment decisions based solely on this information. Always do your own research and consult a qualified financial advisor.
By continuing, you acknowledge that you have read and agree to our full disclaimer & terms of use and privacy policy.