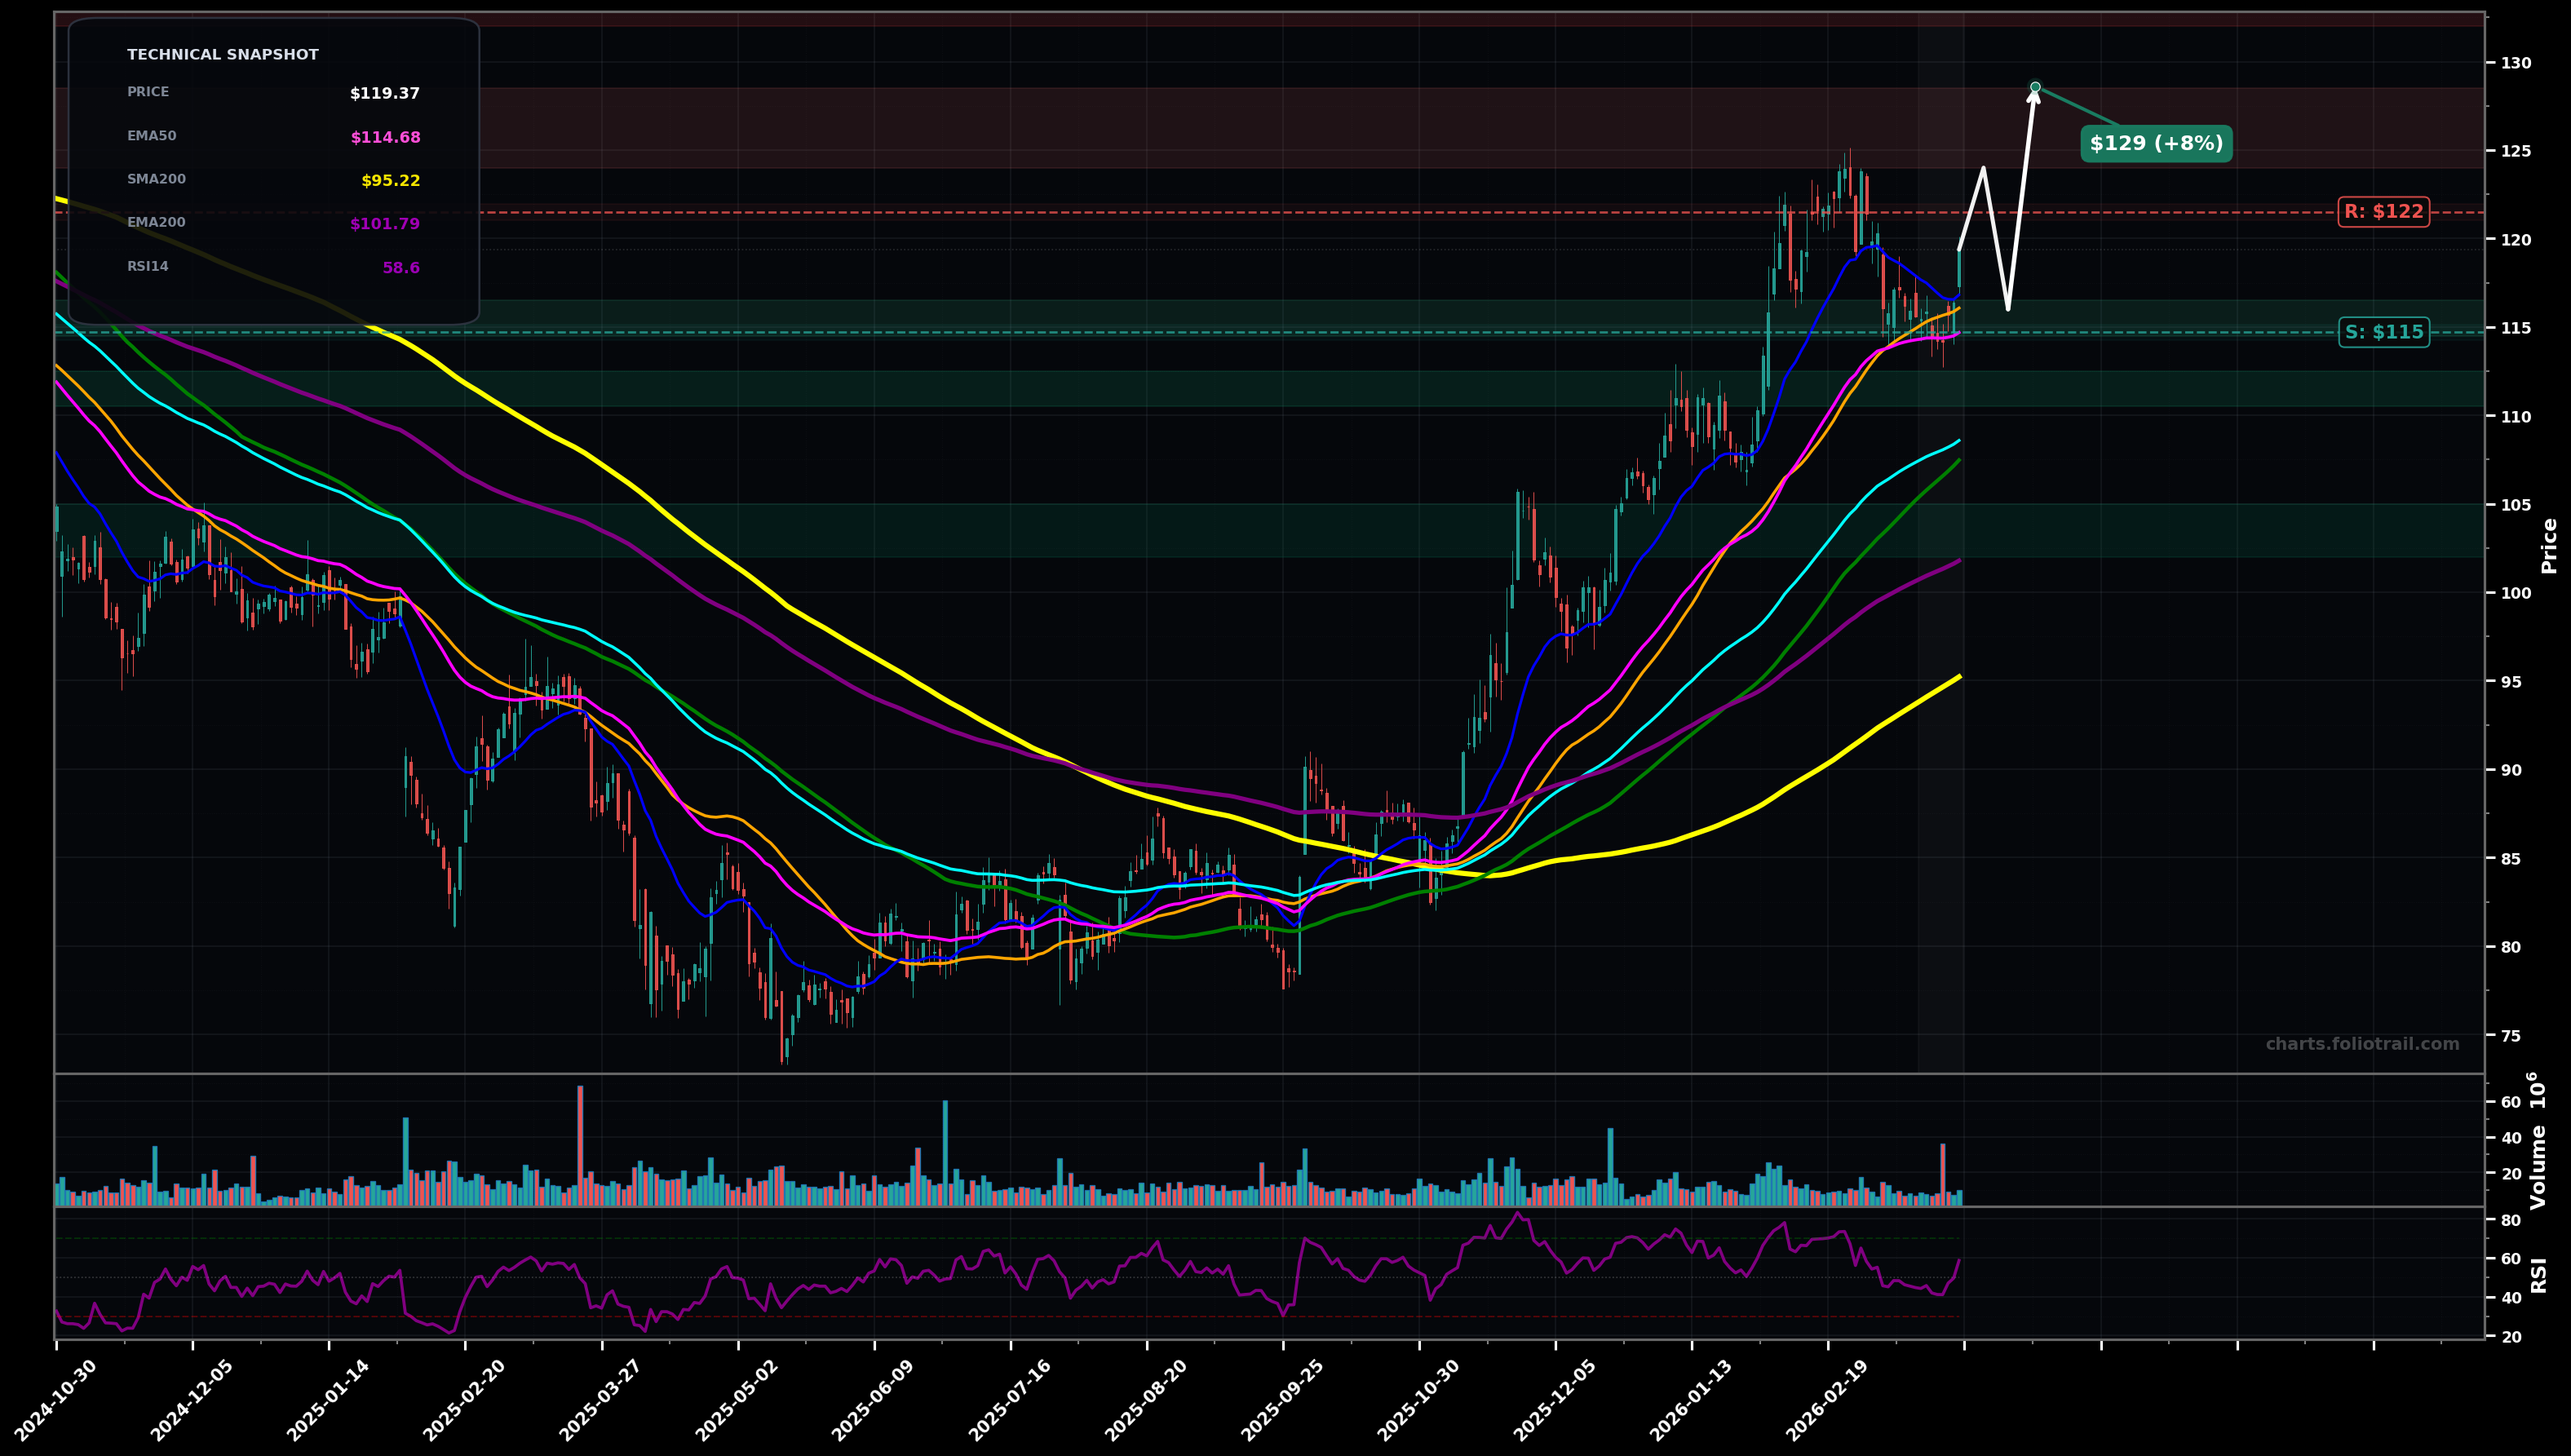
As of March 26, 2026, MRK (Merck & Co., Inc.) is in a uptrend state on the daily chart, with a confidence level of 67%. Key support is at $115 and key resistance at $122. Price ~$119.37 bounced back above the clustered EMA50/SMA50 area after a pullback from the ~$124 swing high; momentum improving (RSI ~58).
Bullish continuation: hold above the EMA50/SMA50 cluster, grind up and retest the prior swing high, with a potential breakout attempt after consolidation.
Bearish pullback: rejection near ~$121-$124 and loss of the EMA50/SMA50 cluster triggers a deeper Fibonacci-style retrace toward the rising EMA100/major horizontal support.
2+ daily closes above $121.50 (reclaim prior supply) would confirm trend continuation toward the highs.
Daily close below $113.50 (loss of EMA50/SMA50 cluster) would invalidate the immediate uptrend and favor deeper retrace.
Start near EMA50/SMA50 confluence; add on a measured retrace to EMA100/structure support; heavy add only near EMA200/SMA100 zone where trend would be re-tested but not necessarily broken.
Trim into prior highs then Fibonacci-extension territory (wave-5 style blow-off risk); heavier trimming on clear extension above prior swing high; full exit only if price becomes extremely stretched vs rising long MAs.
As of March 26, 2026, MRK (Merck & Co., Inc.) is in a uptrend state on the daily chart with 67% confidence. Price ~$119.37 bounced back above the clustered EMA50/SMA50 area after a pullback from the ~$124 swing high; momentum improving (RSI ~58).
On the daily timeframe, MRK has key support at $115 and key resistance at $122. The most likely scenario (bullish) targets $124 and $129, with a revert level at $116.
MRK (Merck & Co., Inc.) is currently classified as uptrend on the daily chart, with 67% confidence. Confirmation requires: 2+ daily closes above $121.50 (reclaim prior supply) would confirm trend continuation toward the highs. This would be invalidated by: Daily close below $113.50 (loss of EMA50/SMA50 cluster) would invalidate the immediate uptrend and favor deeper retrace.
The most likely scenario (bullish) targets $124 and $129, with a revert level at $116. The alternative scenario (bearish) targets $111 and $108.
Multi-layer AI agents analyse 200+ stocks across daily, weekly, and monthly timeframes — producing market state classifications, price scenarios with targets, and position entry/exit levels. Updated every trading day after market close. No paywall. No sign-up required.
Built by Foliotrail.
All content on this website — including charts, analysis, price targets, support/resistance levels, and position zones — is generated entirely by AI and provided for educational and informational purposes only.
This is not financial advice. NEXUSNOIR VENTURES SL (the operator of this website) is not a registered investment adviser or broker-dealer. You should not make investment decisions based solely on this information. Always do your own research and consult a qualified financial advisor.
By continuing, you acknowledge that you have read and agree to our full disclaimer & terms of use and privacy policy.