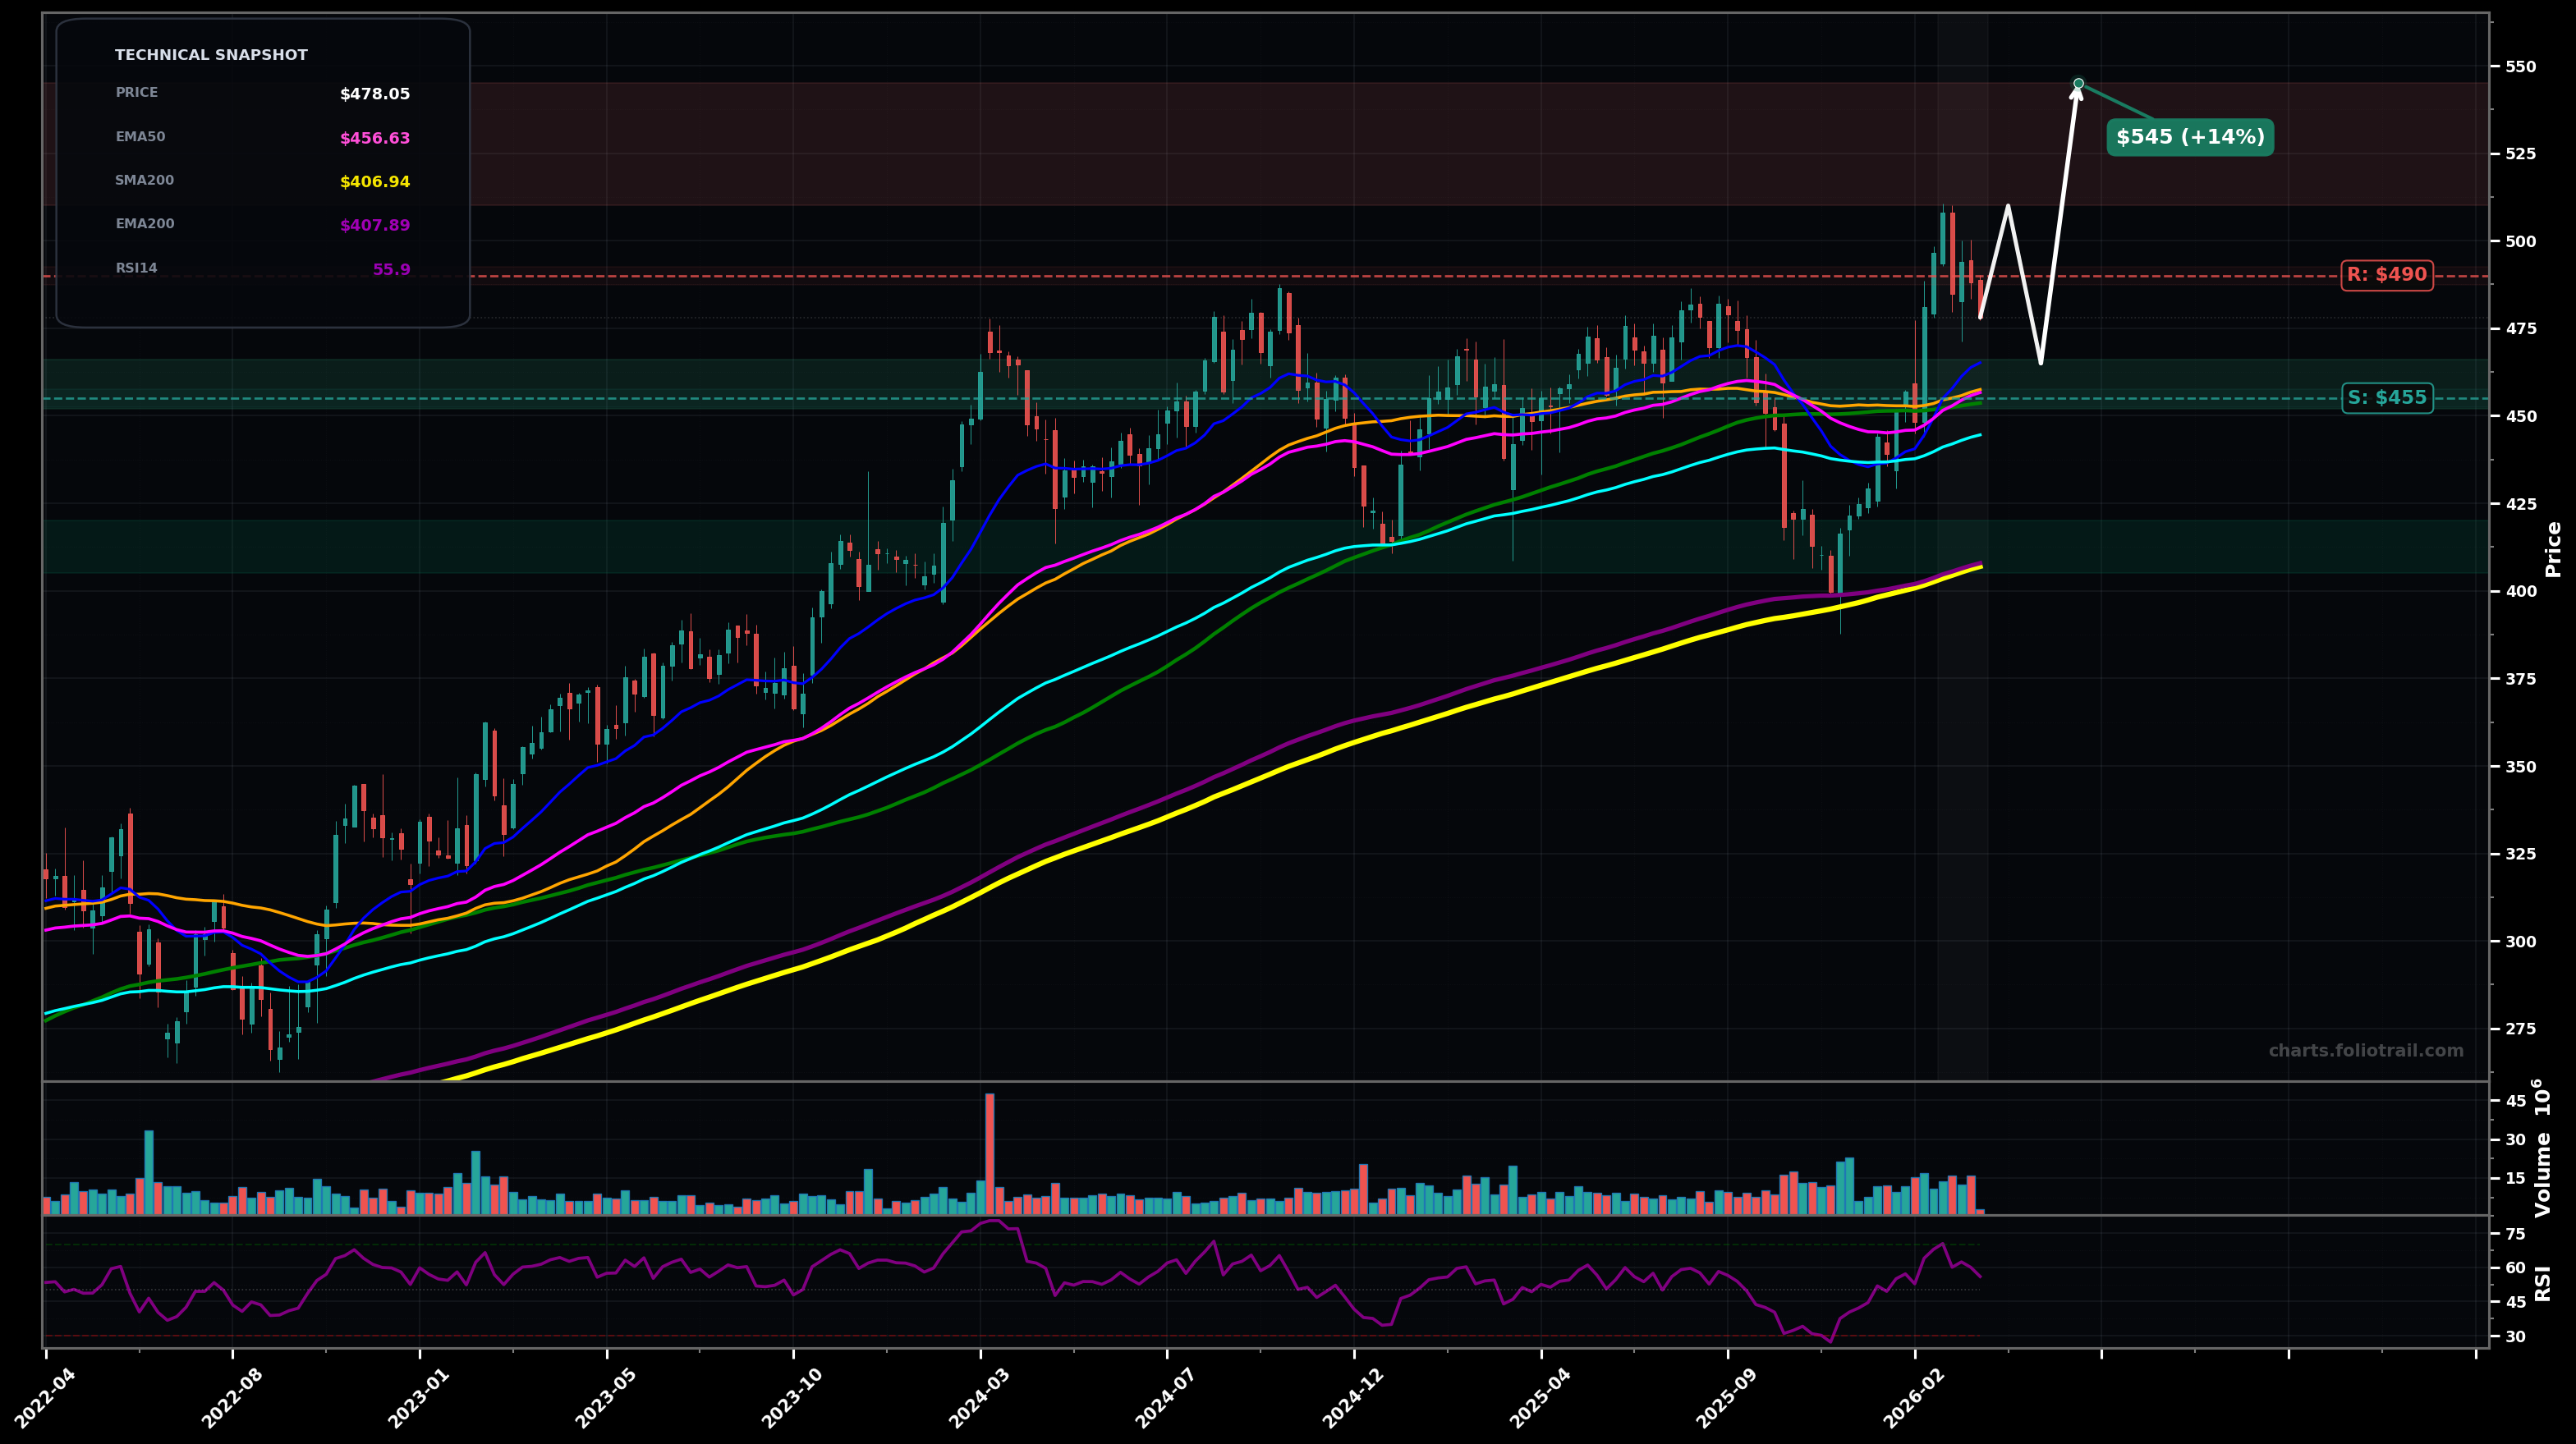
As of March 24, 2026, LIN (Linde plc) is in a uptrend state on the weekly chart, with a confidence level of 64%. Key support is at $455 and key resistance at $490. Weekly pullback after a sharp breakout to new highs (~$510) with price still holding above the clustered $455-$465 MA zone; RSI cooling to ~56.
Bullish continuation: current pullback acts as a wave (4) / post-breakout retest into the $455-$465 MA cluster, then buyers attempt another push toward the prior high and extension.
Deeper correction: failure to hold the MA cluster triggers a larger ABC pullback toward the prior breakout area / Fib retrace of the $410→$510 impulse, before a base attempt.
Weekly close back above $490
Weekly close below $445
Start near EMA50/SMA50+EMA20 congestion (~$455-$465); add on a clean break/retest toward EMA100 (~$445); heavy add only near the prior base + long-term trend MAs (EMA200/SMA200 ~ $407).
Trim into prior-high supply ($510+) and Fib extensions (~$545/$600); close only if price becomes multi-year stretched far above rising long-term MAs (extension blow-off risk).
As of March 24, 2026, LIN (Linde plc) is in a uptrend state on the weekly chart with 64% confidence. Weekly pullback after a sharp breakout to new highs (~$510) with price still holding above the clustered $455-$465 MA zone; RSI cooling to ~56.
On the weekly timeframe, LIN has key support at $455 and key resistance at $490. The most likely scenario (bullish) targets $510 and $545, with a revert level at $465.
LIN (Linde plc) is currently classified as uptrend on the weekly chart, with 64% confidence. Confirmation requires: Weekly close back above $490 This would be invalidated by: Weekly close below $445
The most likely scenario (bullish) targets $510 and $545, with a revert level at $465. The alternative scenario (bearish) targets $445 and $410.
All content on this website — including charts, analysis, price targets, support/resistance levels, and position zones — is generated entirely by AI and provided for educational and informational purposes only.
This is not financial advice. NEXUSNOIR VENTURES SL (the operator of this website) is not a registered investment adviser or broker-dealer. You should not make investment decisions based solely on this information. Always do your own research and consult a qualified financial advisor.
By continuing, you acknowledge that you have read and agree to our full disclaimer & terms of use and privacy policy.