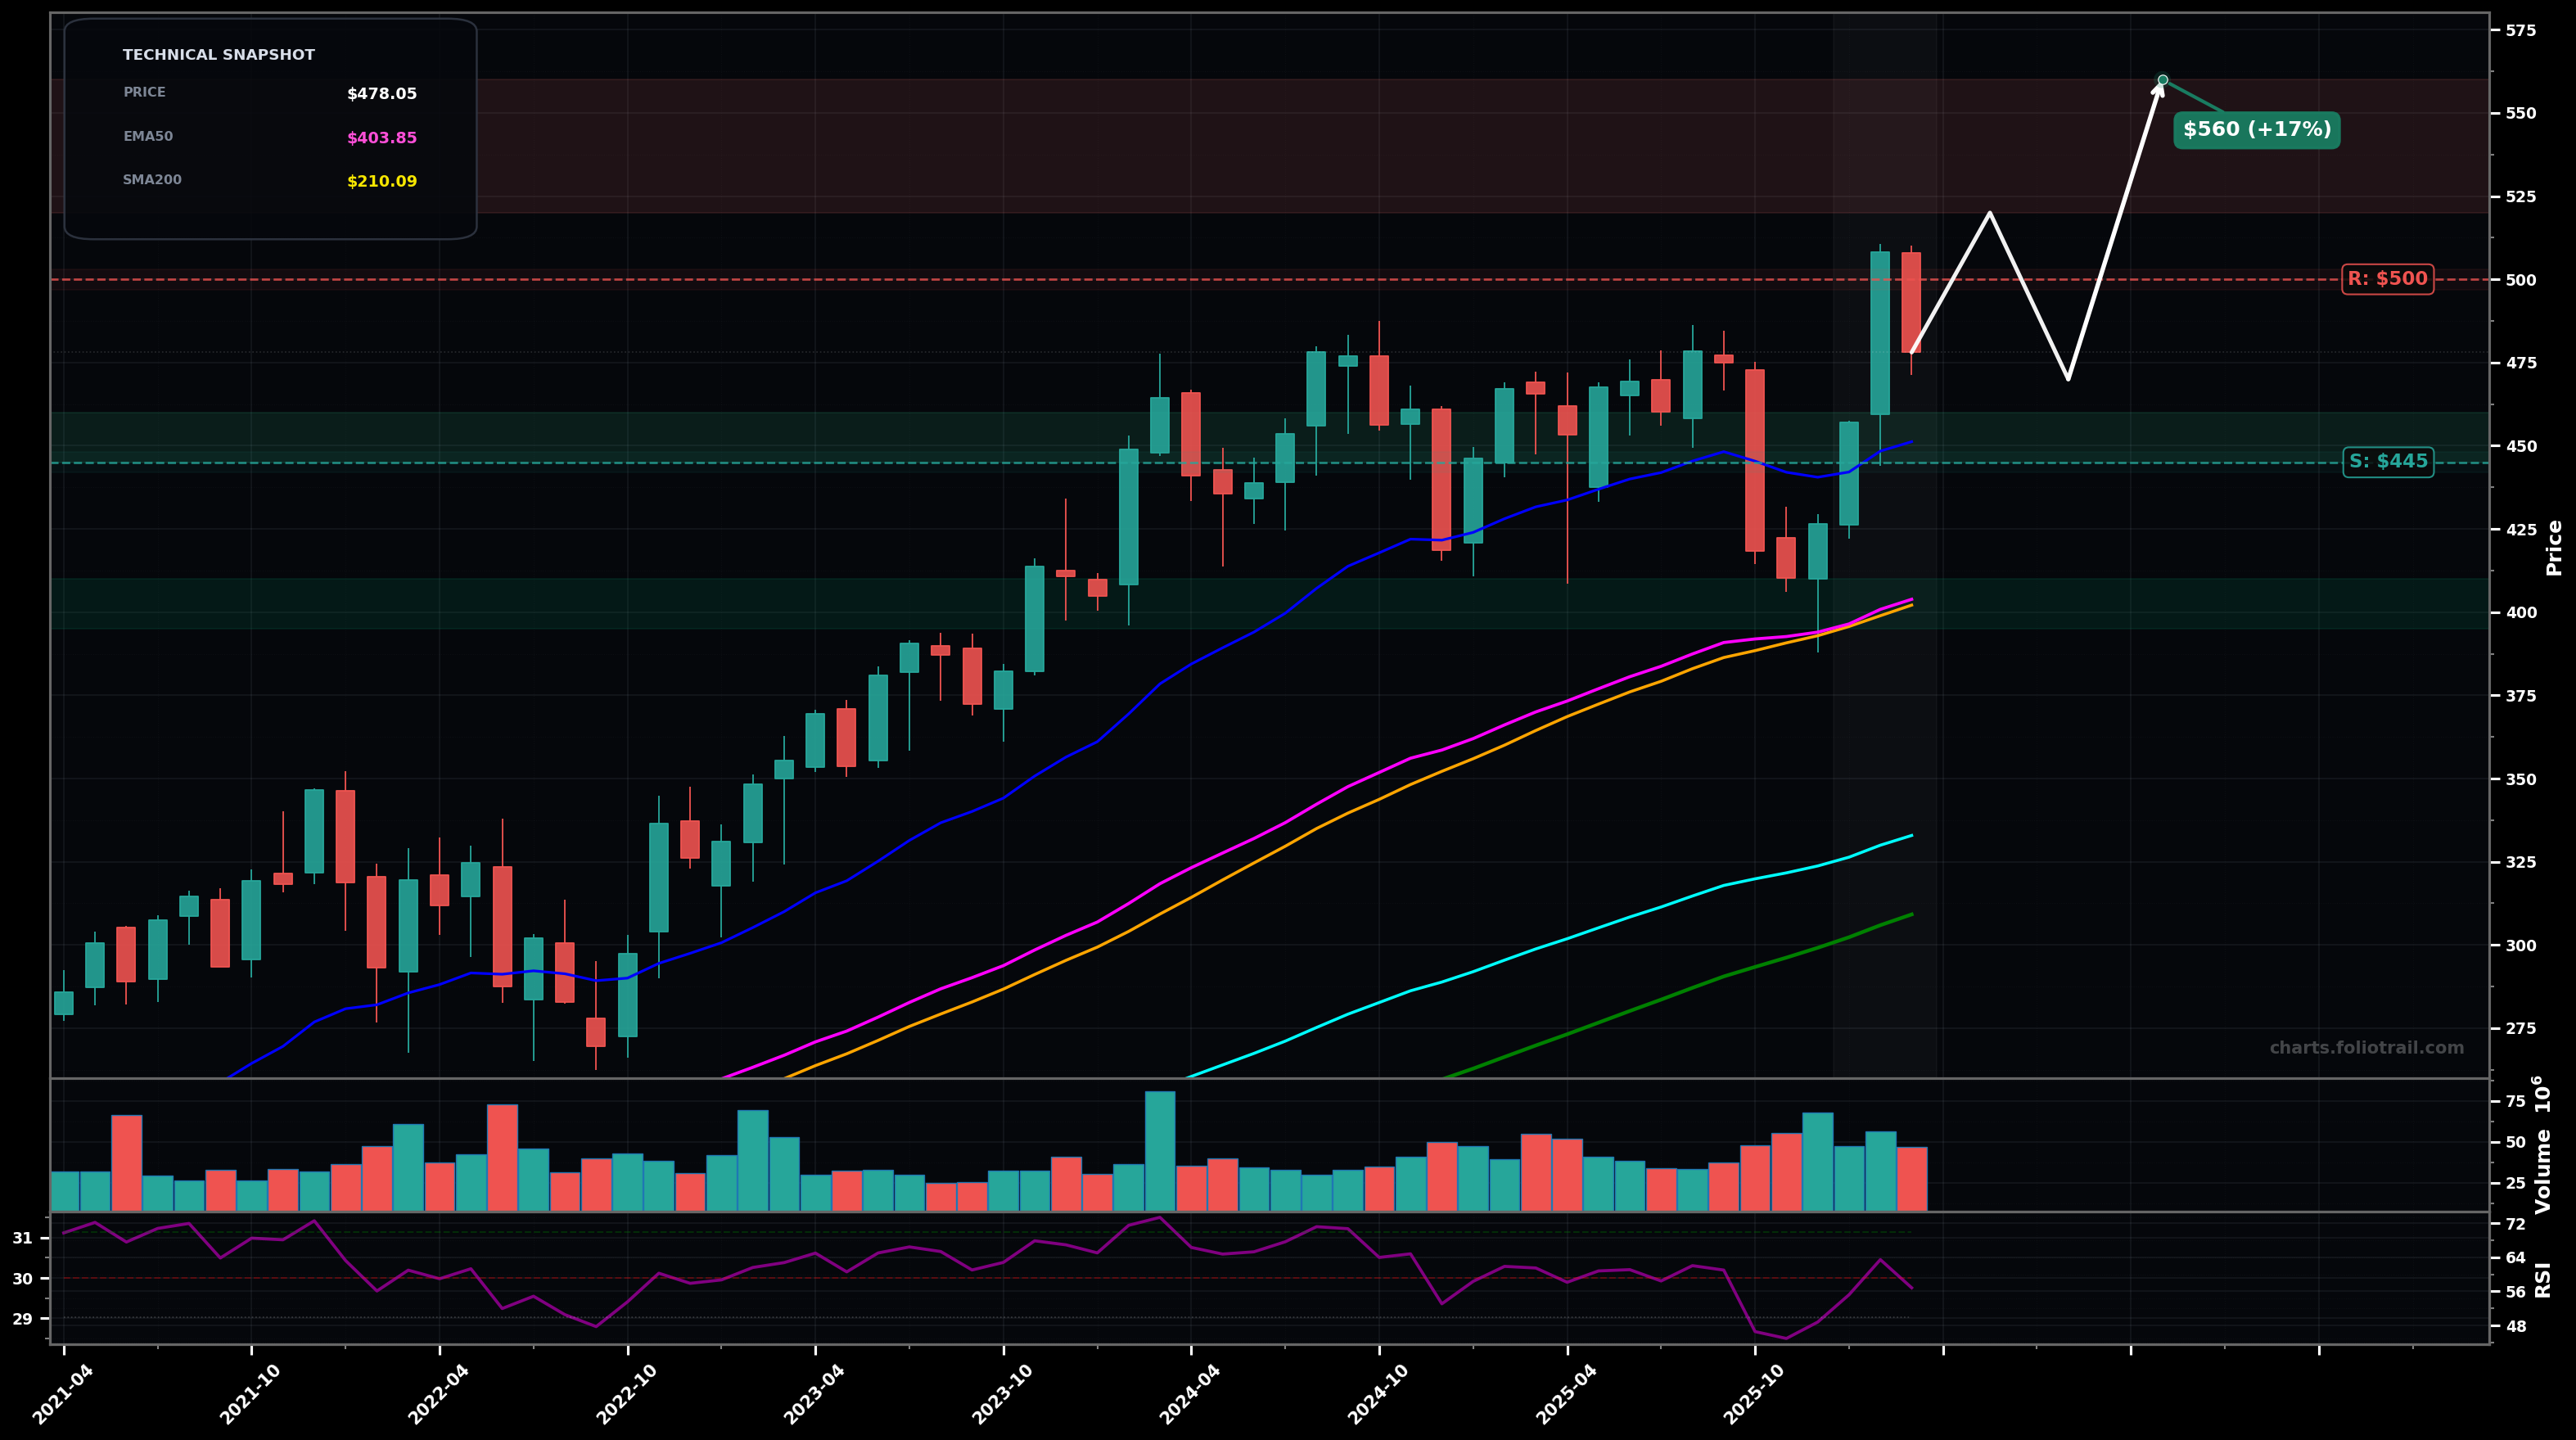
As of March 24, 2026, LIN (Linde plc) is in a uptrend state on the monthly chart, with a confidence level of 72%. Key support is at $445 and key resistance at $500. Monthly trend remains HH/HL; price pushed to new highs near $500 then pulled back to ~$478, still well above rising EMA50/SMA50.
Bullish continuation: consolidation/pullback holds above the prior breakout area, then a push through $500 resumes the primary impulse (Elliott: likely late Wave 3/early Wave 5 continuation depending on your anchor; Fib extension zone becomes active above the prior high).
Deeper corrective retrace: rejection from the $500 area leads to an ABC-style pullback toward the rising EMA50/SMA50 confluence; trend remains intact unless the $445 swing level breaks on a monthly close.
Monthly close back above $500 would confirm trend continuation/expansion.
Monthly close below $445 would invalidate the current HH/HL swing structure and raise odds of a deeper corrective phase.
Start near prior breakout/structure support ($445-$460), add on a measured retrace into the $420s, heavy add at EMA50/SMA50 confluence (~$404) where trend buyers typically defend.
Trim into new highs/extension above $500 as price stretches away from EMA50/SMA50; increase trimming into larger Fib-extension zones, close if it becomes significantly extended versus long MAs (parabolic-risk region).
As of March 24, 2026, LIN (Linde plc) is in a uptrend state on the monthly chart with 72% confidence. Monthly trend remains HH/HL; price pushed to new highs near $500 then pulled back to ~$478, still well above rising EMA50/SMA50.
On the monthly timeframe, LIN has key support at $445 and key resistance at $500. The most likely scenario (bullish) targets $520 and $560, with a revert level at $470.
LIN (Linde plc) is currently classified as uptrend on the monthly chart, with 72% confidence. Confirmation requires: Monthly close back above $500 would confirm trend continuation/expansion. This would be invalidated by: Monthly close below $445 would invalidate the current HH/HL swing structure and raise odds of a deeper corrective phase.
The most likely scenario (bullish) targets $520 and $560, with a revert level at $470. The alternative scenario (bearish) targets $430 and $405.
All content on this website — including charts, analysis, price targets, support/resistance levels, and position zones — is generated entirely by AI and provided for educational and informational purposes only.
This is not financial advice. NEXUSNOIR VENTURES SL (the operator of this website) is not a registered investment adviser or broker-dealer. You should not make investment decisions based solely on this information. Always do your own research and consult a qualified financial advisor.
By continuing, you acknowledge that you have read and agree to our full disclaimer & terms of use and privacy policy.