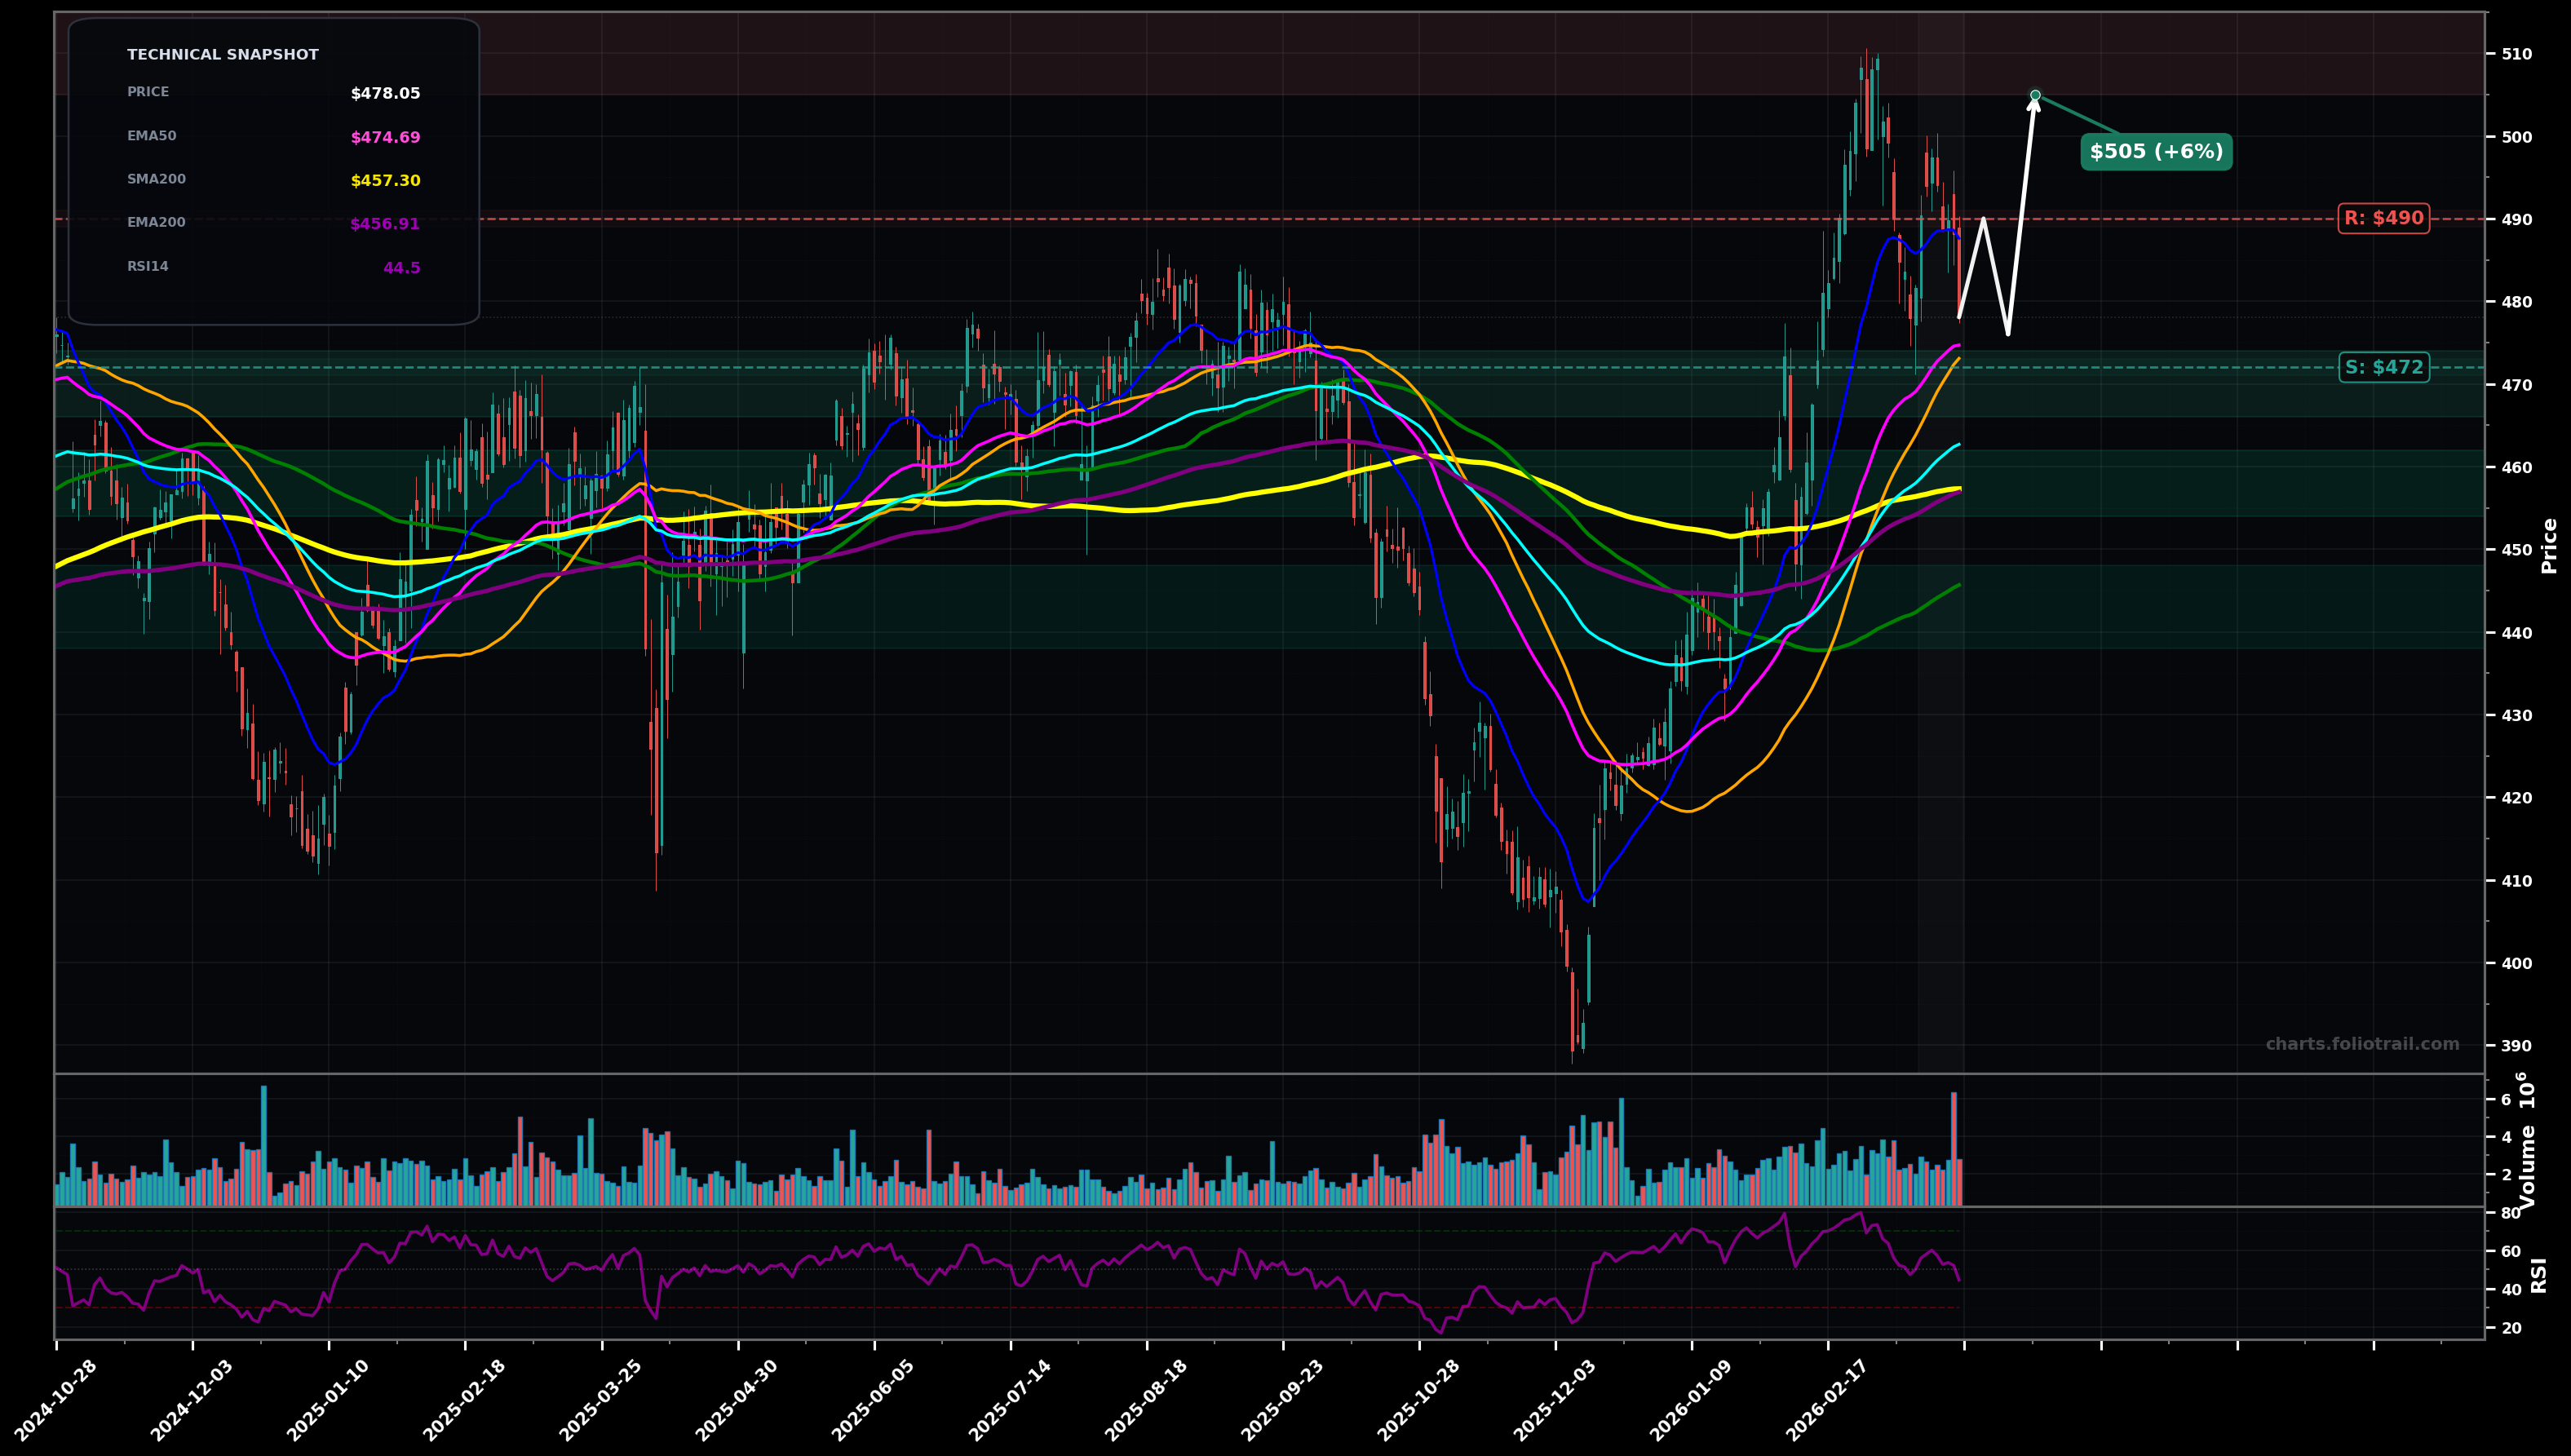
As of March 24, 2026, LIN (Linde plc) is in a bottoming attempt state on the daily chart, with a confidence level of 58%. Key support is at $472 and key resistance at $490. Sharp run-up to ~$510 followed by a pullback; price ~$478 is back below the short-term EMA20 and sitting near the EMA50/SMA50 cluster, with momentum cooling (RSI ~44).
Base-and-bounce: hold the $472–$465 MA cluster, then reclaim $488–$490 and attempt a retest of the prior supply zone.
Deeper pullback: fail to reclaim $490, lose $472, and mean-revert toward the long-term MA shelf before stabilization.
2+ daily closes back above $488 (reclaim EMA20 area) would confirm a renewed upside push from this pullback
Daily close below $456 (loss of the EMA200/SMA200 zone) would invalidate the bottoming/rebound posture and favor a deeper downtrend leg
Start near EMA50/SMA50 support (~$473), add on a controlled breakdown toward EMA200/SMA200 (~$457), heavy add only at the next demand shelf/round-trip support (~$445) aligning with prior consolidation and fib mean-reversion.
Trim into prior swing-high supply (~$510) and extension zones (fib-based overextension above the $390–$510 impulse), close aggressively only if price becomes multi-year stretched far above long MAs with parabolic characteristics.
As of March 24, 2026, LIN (Linde plc) is in a bottoming attempt state on the daily chart with 58% confidence. Sharp run-up to ~$510 followed by a pullback; price ~$478 is back below the short-term EMA20 and sitting near the EMA50/SMA50 cluster, with momentum cooling (RSI ~44).
On the daily timeframe, LIN has key support at $472 and key resistance at $490. The most likely scenario (bullish) targets $490 and $505, with a revert level at $476.
LIN (Linde plc) is currently classified as bottoming attempt on the daily chart, with 58% confidence. Confirmation requires: 2+ daily closes back above $488 (reclaim EMA20 area) would confirm a renewed upside push from this pullback This would be invalidated by: Daily close below $456 (loss of the EMA200/SMA200 zone) would invalidate the bottoming/rebound posture and favor a deeper downtrend leg
The most likely scenario (bullish) targets $490 and $505, with a revert level at $476. The alternative scenario (bearish) targets $458 and $445.
All content on this website — including charts, analysis, price targets, support/resistance levels, and position zones — is generated entirely by AI and provided for educational and informational purposes only.
This is not financial advice. NEXUSNOIR VENTURES SL (the operator of this website) is not a registered investment adviser or broker-dealer. You should not make investment decisions based solely on this information. Always do your own research and consult a qualified financial advisor.
By continuing, you acknowledge that you have read and agree to our full disclaimer & terms of use and privacy policy.