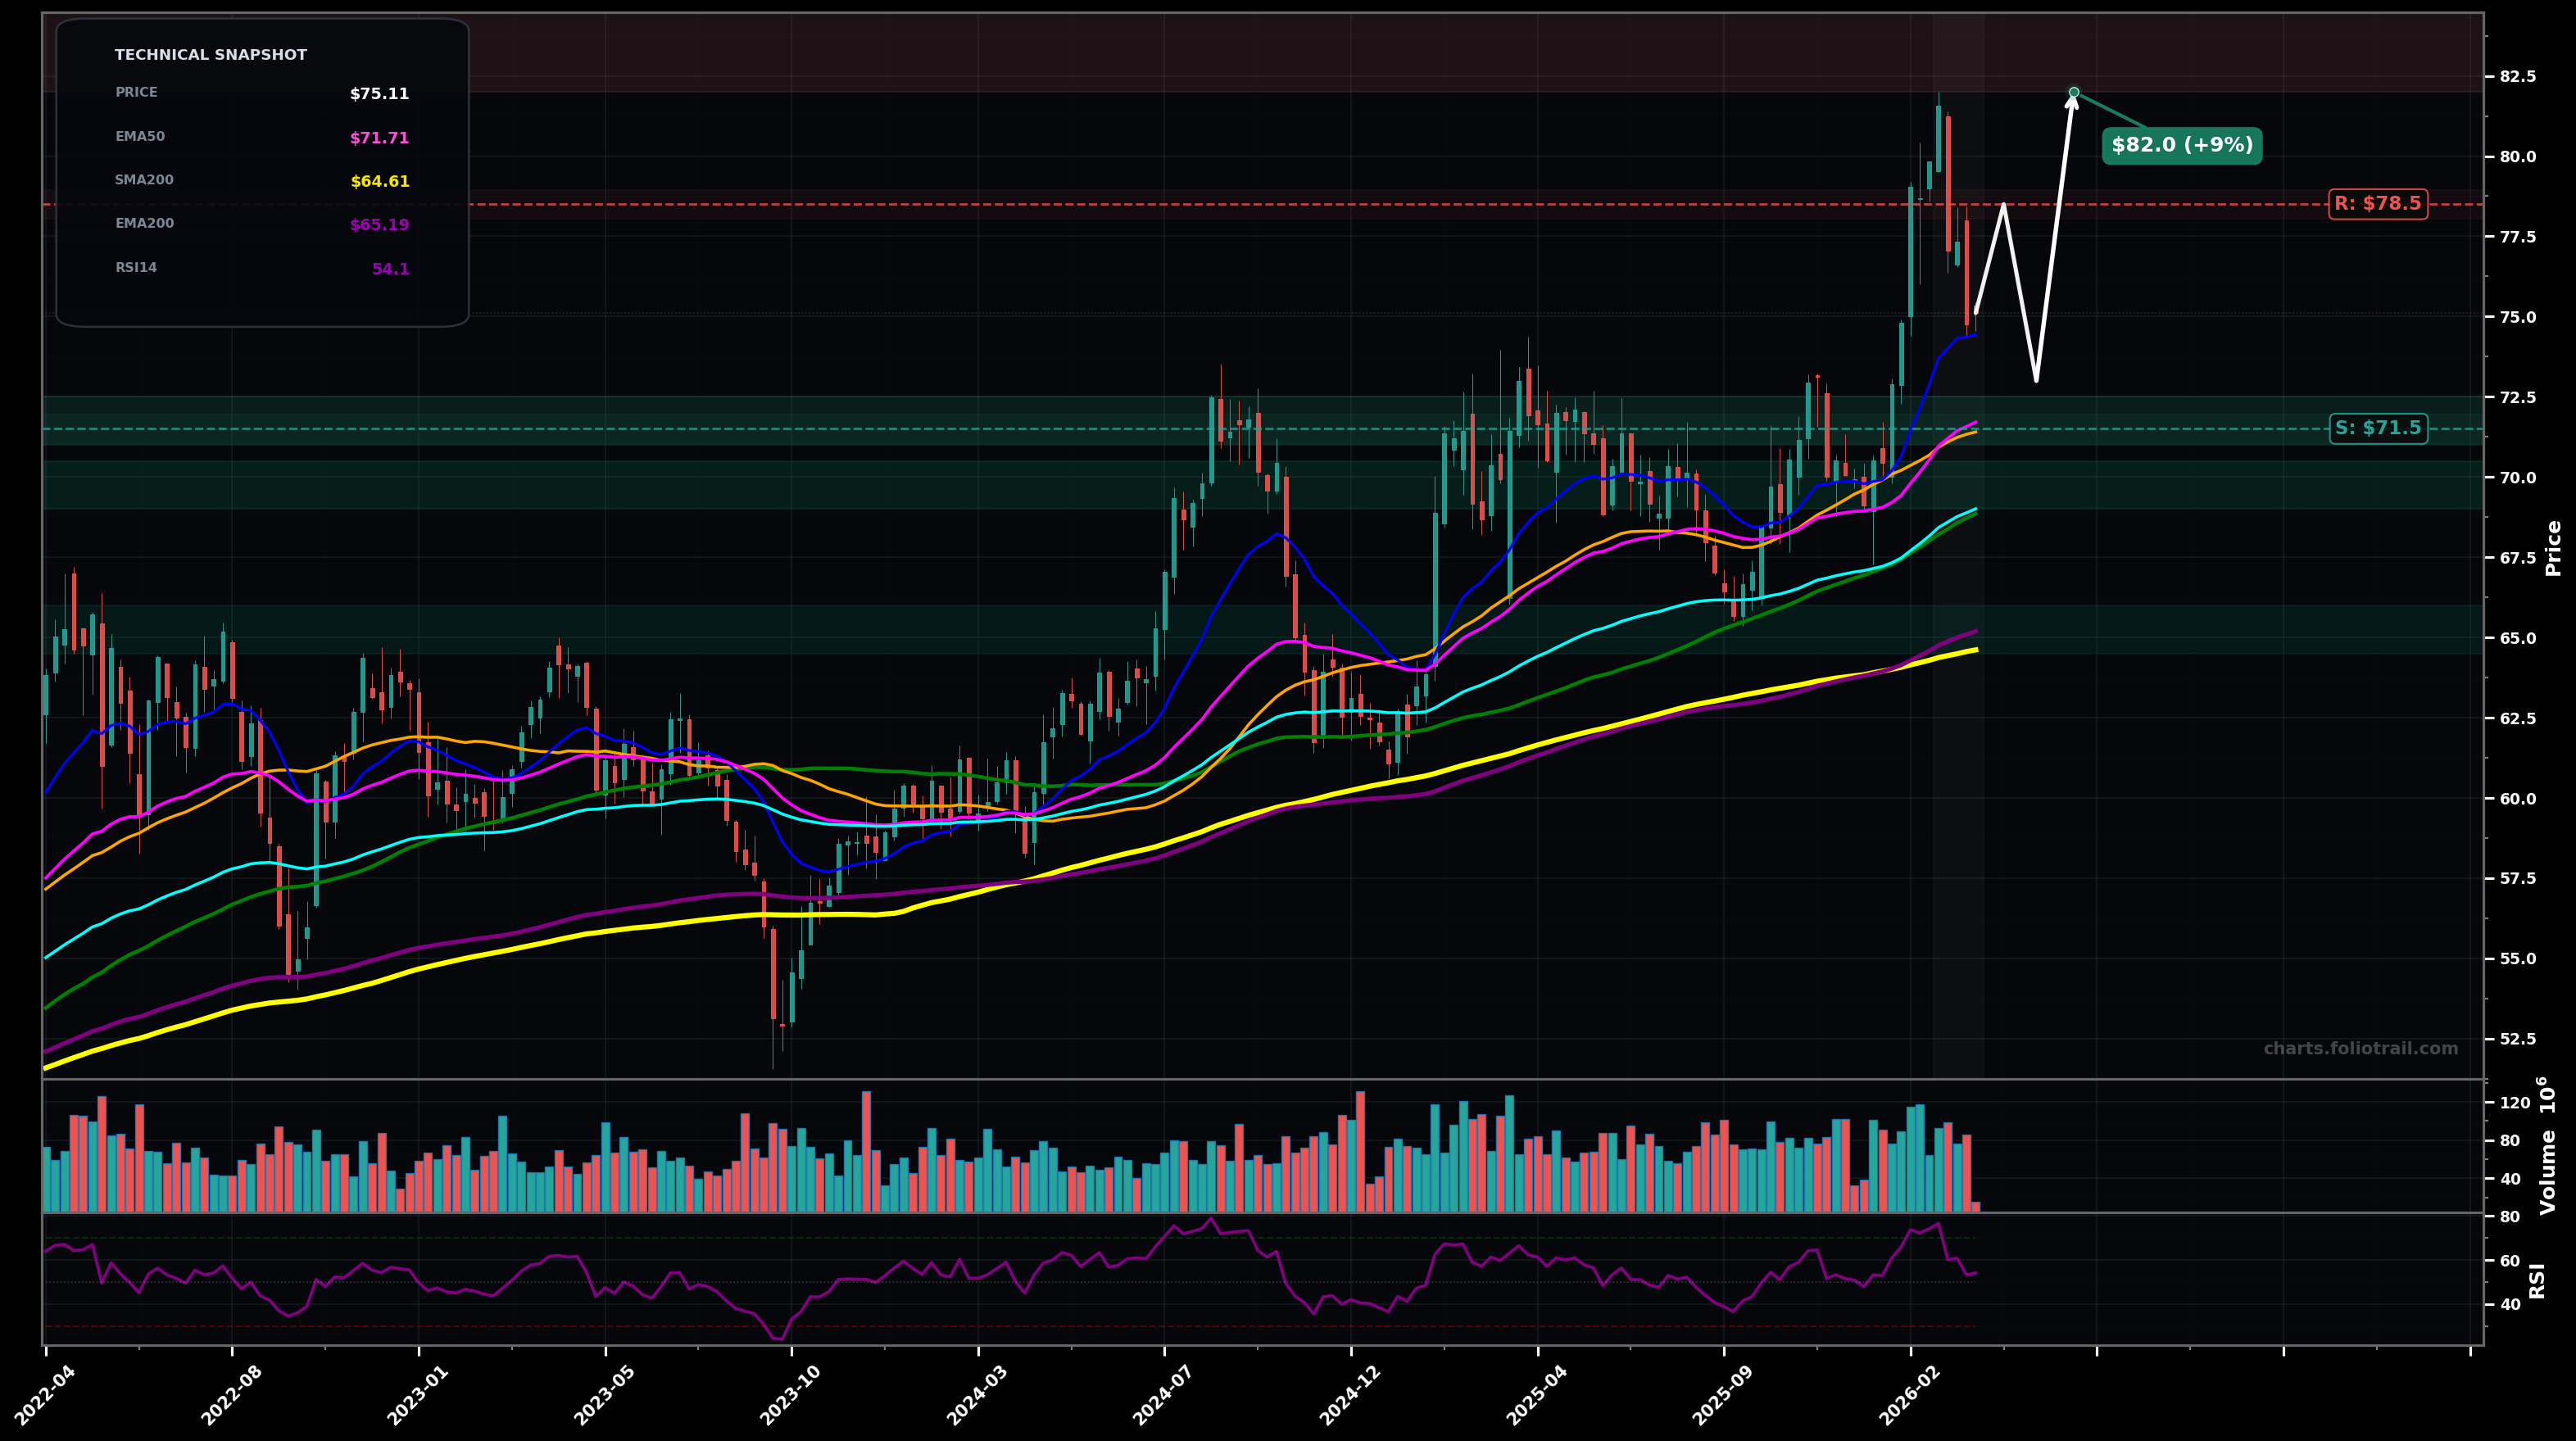
As of March 24, 2026, KO (The Coca-Cola Company) is in a uptrend state on the weekly chart, with a confidence level of 72%. Key support is at $71.5 and key resistance at $78.5. Sharp breakout to new swing high near ~$82 followed by quick pullback to ~$75; still holding above EMA50/SMA50 zone.
Bullish continuation: pullback finishes as a Wave 4 / ABC correction into the ~$71–$73 confluence, then Wave 5 push retests the breakout high and extends modestly.
Deeper mean reversion: the spike to ~$82 marks a short-term Wave 5 blow-off; price breaks below the ~$71–$72 cluster and revisits the prior swing zone near EMA100 (cyan) before stabilizing.
Weekly close back above $78.00 (follow-through after the pullback) would confirm trend continuation.
Weekly close below $70.50 (loss of EMA50/SMA50 area and prior breakout support) would invalidate the current uptrend posture.
Buy zones are anchored to the MA confluence (EMA50/SMA50), then EMA100, then EMA200/SMA200 area where prior swing support and long-term trend support typically attract demand.
Trim into extension above the recent breakout high (likely Wave 5 zone); larger trims/exit into increasingly stretched multiples vs the rising long-term MAs where mean-reversion risk rises.
As of March 24, 2026, KO (The Coca-Cola Company) is in a uptrend state on the weekly chart with 72% confidence. Sharp breakout to new swing high near ~$82 followed by quick pullback to ~$75; still holding above EMA50/SMA50 zone.
On the weekly timeframe, KO has key support at $71.5 and key resistance at $78.5. The most likely scenario (bullish) targets $78.5 and $82.0, with a revert level at $73.0.
KO (The Coca-Cola Company) is currently classified as uptrend on the weekly chart, with 72% confidence. Confirmation requires: Weekly close back above $78.00 (follow-through after the pullback) would confirm trend continuation. This would be invalidated by: Weekly close below $70.50 (loss of EMA50/SMA50 area and prior breakout support) would invalidate the current uptrend posture.
The most likely scenario (bullish) targets $78.5 and $82.0, with a revert level at $73.0. The alternative scenario (bearish) targets $69.0 and $65.0.
All content on this website — including charts, analysis, price targets, support/resistance levels, and position zones — is generated entirely by AI and provided for educational and informational purposes only.
This is not financial advice. NEXUSNOIR VENTURES SL (the operator of this website) is not a registered investment adviser or broker-dealer. You should not make investment decisions based solely on this information. Always do your own research and consult a qualified financial advisor.
By continuing, you acknowledge that you have read and agree to our full disclaimer & terms of use and privacy policy.