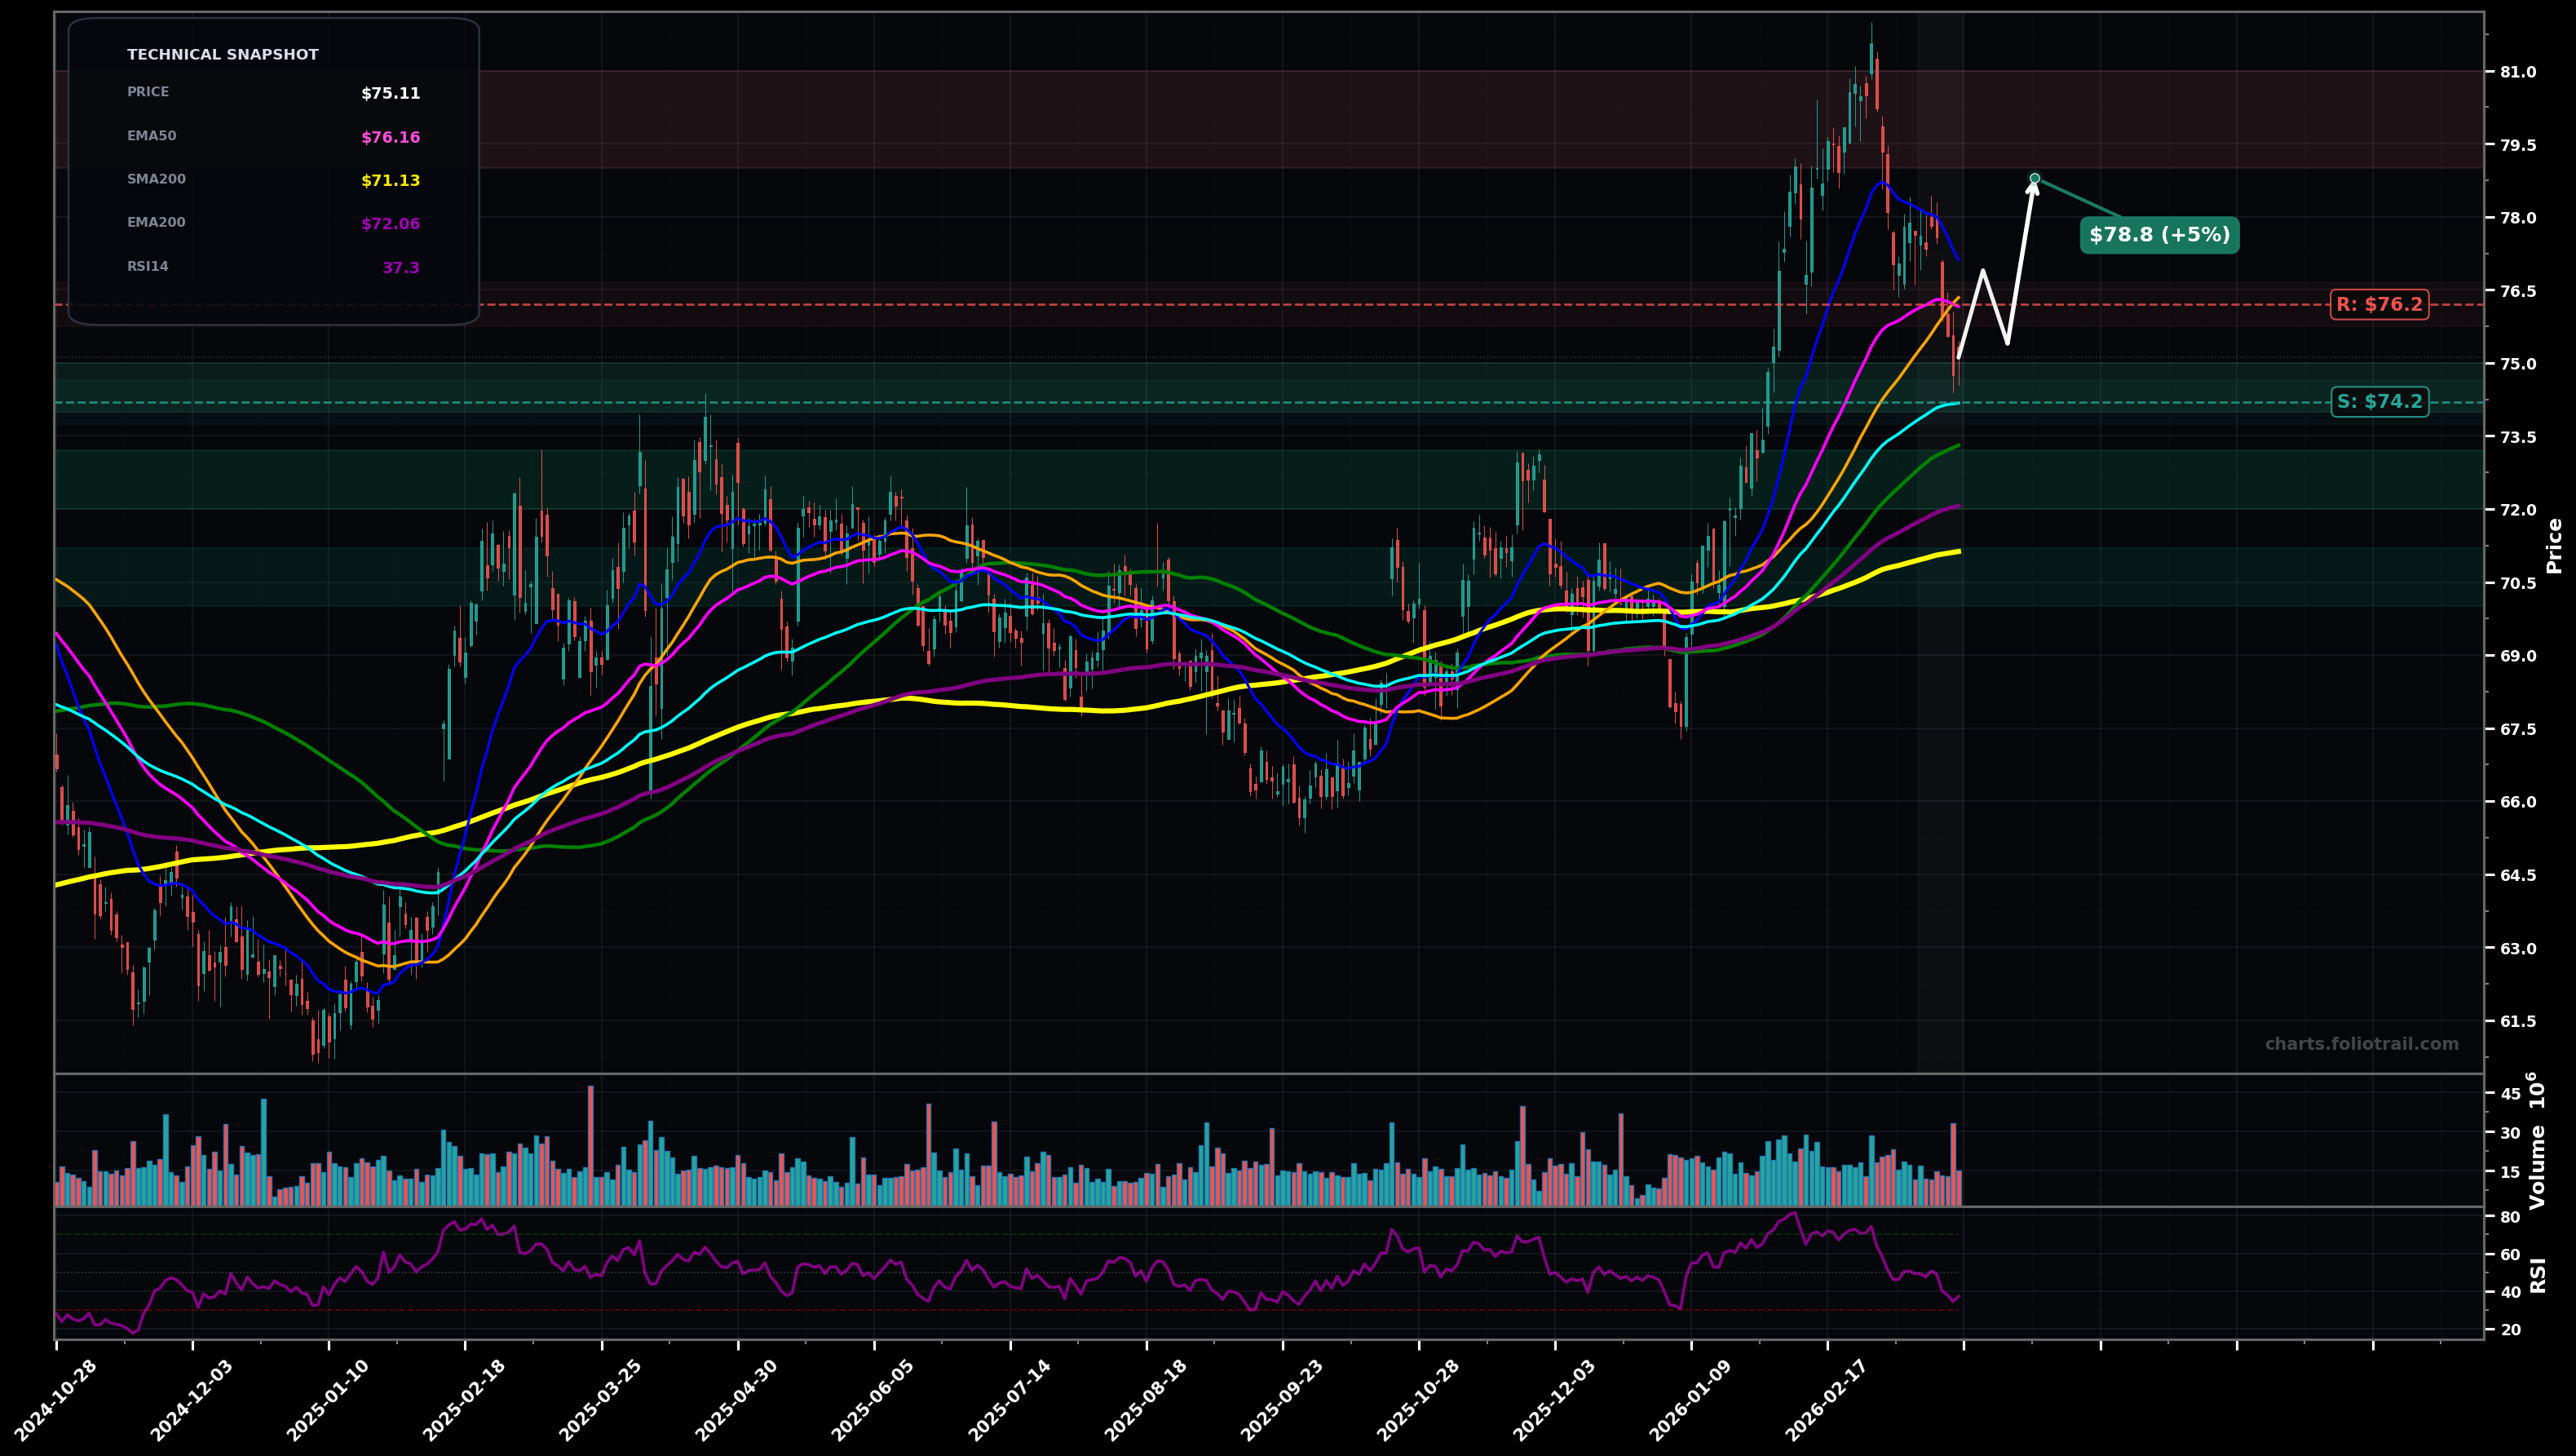
As of March 24, 2026, KO (The Coca-Cola Company) is in a bottoming attempt state on the daily chart, with a confidence level of 62%. Key support is at $74.2 and key resistance at $76.2. Sharp pullback from ~$81 peak into ~$75.11, losing the fast MAs (SMA50/EMA50/EMA20) while still holding above the longer MAs (EMA100/EMA200/SMA200). RSI(14) ~37 suggests momentum reset/near-oversold.
Mean-reversion bounce from the EMA100 area, first re-testing the broken MA band near $76-$77, then attempting to rebuild toward the prior breakout zone near $78.50-$79 if buyers regain control.
Support fails and KO slides into the long-term MA shelf: a breakdown below EMA100 leads to a test of EMA200/SMA200, with a possible brief bounce, then another leg lower if $71 gives way (post-parabolic unwind).
Daily close back above $76.20 and hold 2+ closes (reclaim EMA50 area) would confirm a bottoming attempt turning into a rebound
Daily close below $71.10 (loss of SMA200) would invalidate and raise odds of a deeper downtrend
Scale-in at EMA100 support first, add at EMA200 confluence, heavy add only near/under SMA200 where invalidation risk is highest but reward improves.
Trim into prior peak/extension zones (parabolic top area) and progressively de-risk if price stretches far above the MA stack again (typical Elliott wave 5/euphoria risk).
As of March 24, 2026, KO (The Coca-Cola Company) is in a bottoming attempt state on the daily chart with 62% confidence. Sharp pullback from ~$81 peak into ~$75.11, losing the fast MAs (SMA50/EMA50/EMA20) while still holding above the longer MAs (EMA100/EMA200/SMA200). RSI(14) ~37 suggests momentum reset/near-oversold.
On the daily timeframe, KO has key support at $74.2 and key resistance at $76.2. The most likely scenario (bullish) targets $76.9 and $78.8, with a revert level at $75.4.
KO (The Coca-Cola Company) is currently classified as bottoming attempt on the daily chart, with 62% confidence. Confirmation requires: Daily close back above $76.20 and hold 2+ closes (reclaim EMA50 area) would confirm a bottoming attempt turning into a rebound This would be invalidated by: Daily close below $71.10 (loss of SMA200) would invalidate and raise odds of a deeper downtrend
The most likely scenario (bullish) targets $76.9 and $78.8, with a revert level at $75.4. The alternative scenario (bearish) targets $72.1 and $70.0.
All content on this website — including charts, analysis, price targets, support/resistance levels, and position zones — is generated entirely by AI and provided for educational and informational purposes only.
This is not financial advice. NEXUSNOIR VENTURES SL (the operator of this website) is not a registered investment adviser or broker-dealer. You should not make investment decisions based solely on this information. Always do your own research and consult a qualified financial advisor.
By continuing, you acknowledge that you have read and agree to our full disclaimer & terms of use and privacy policy.