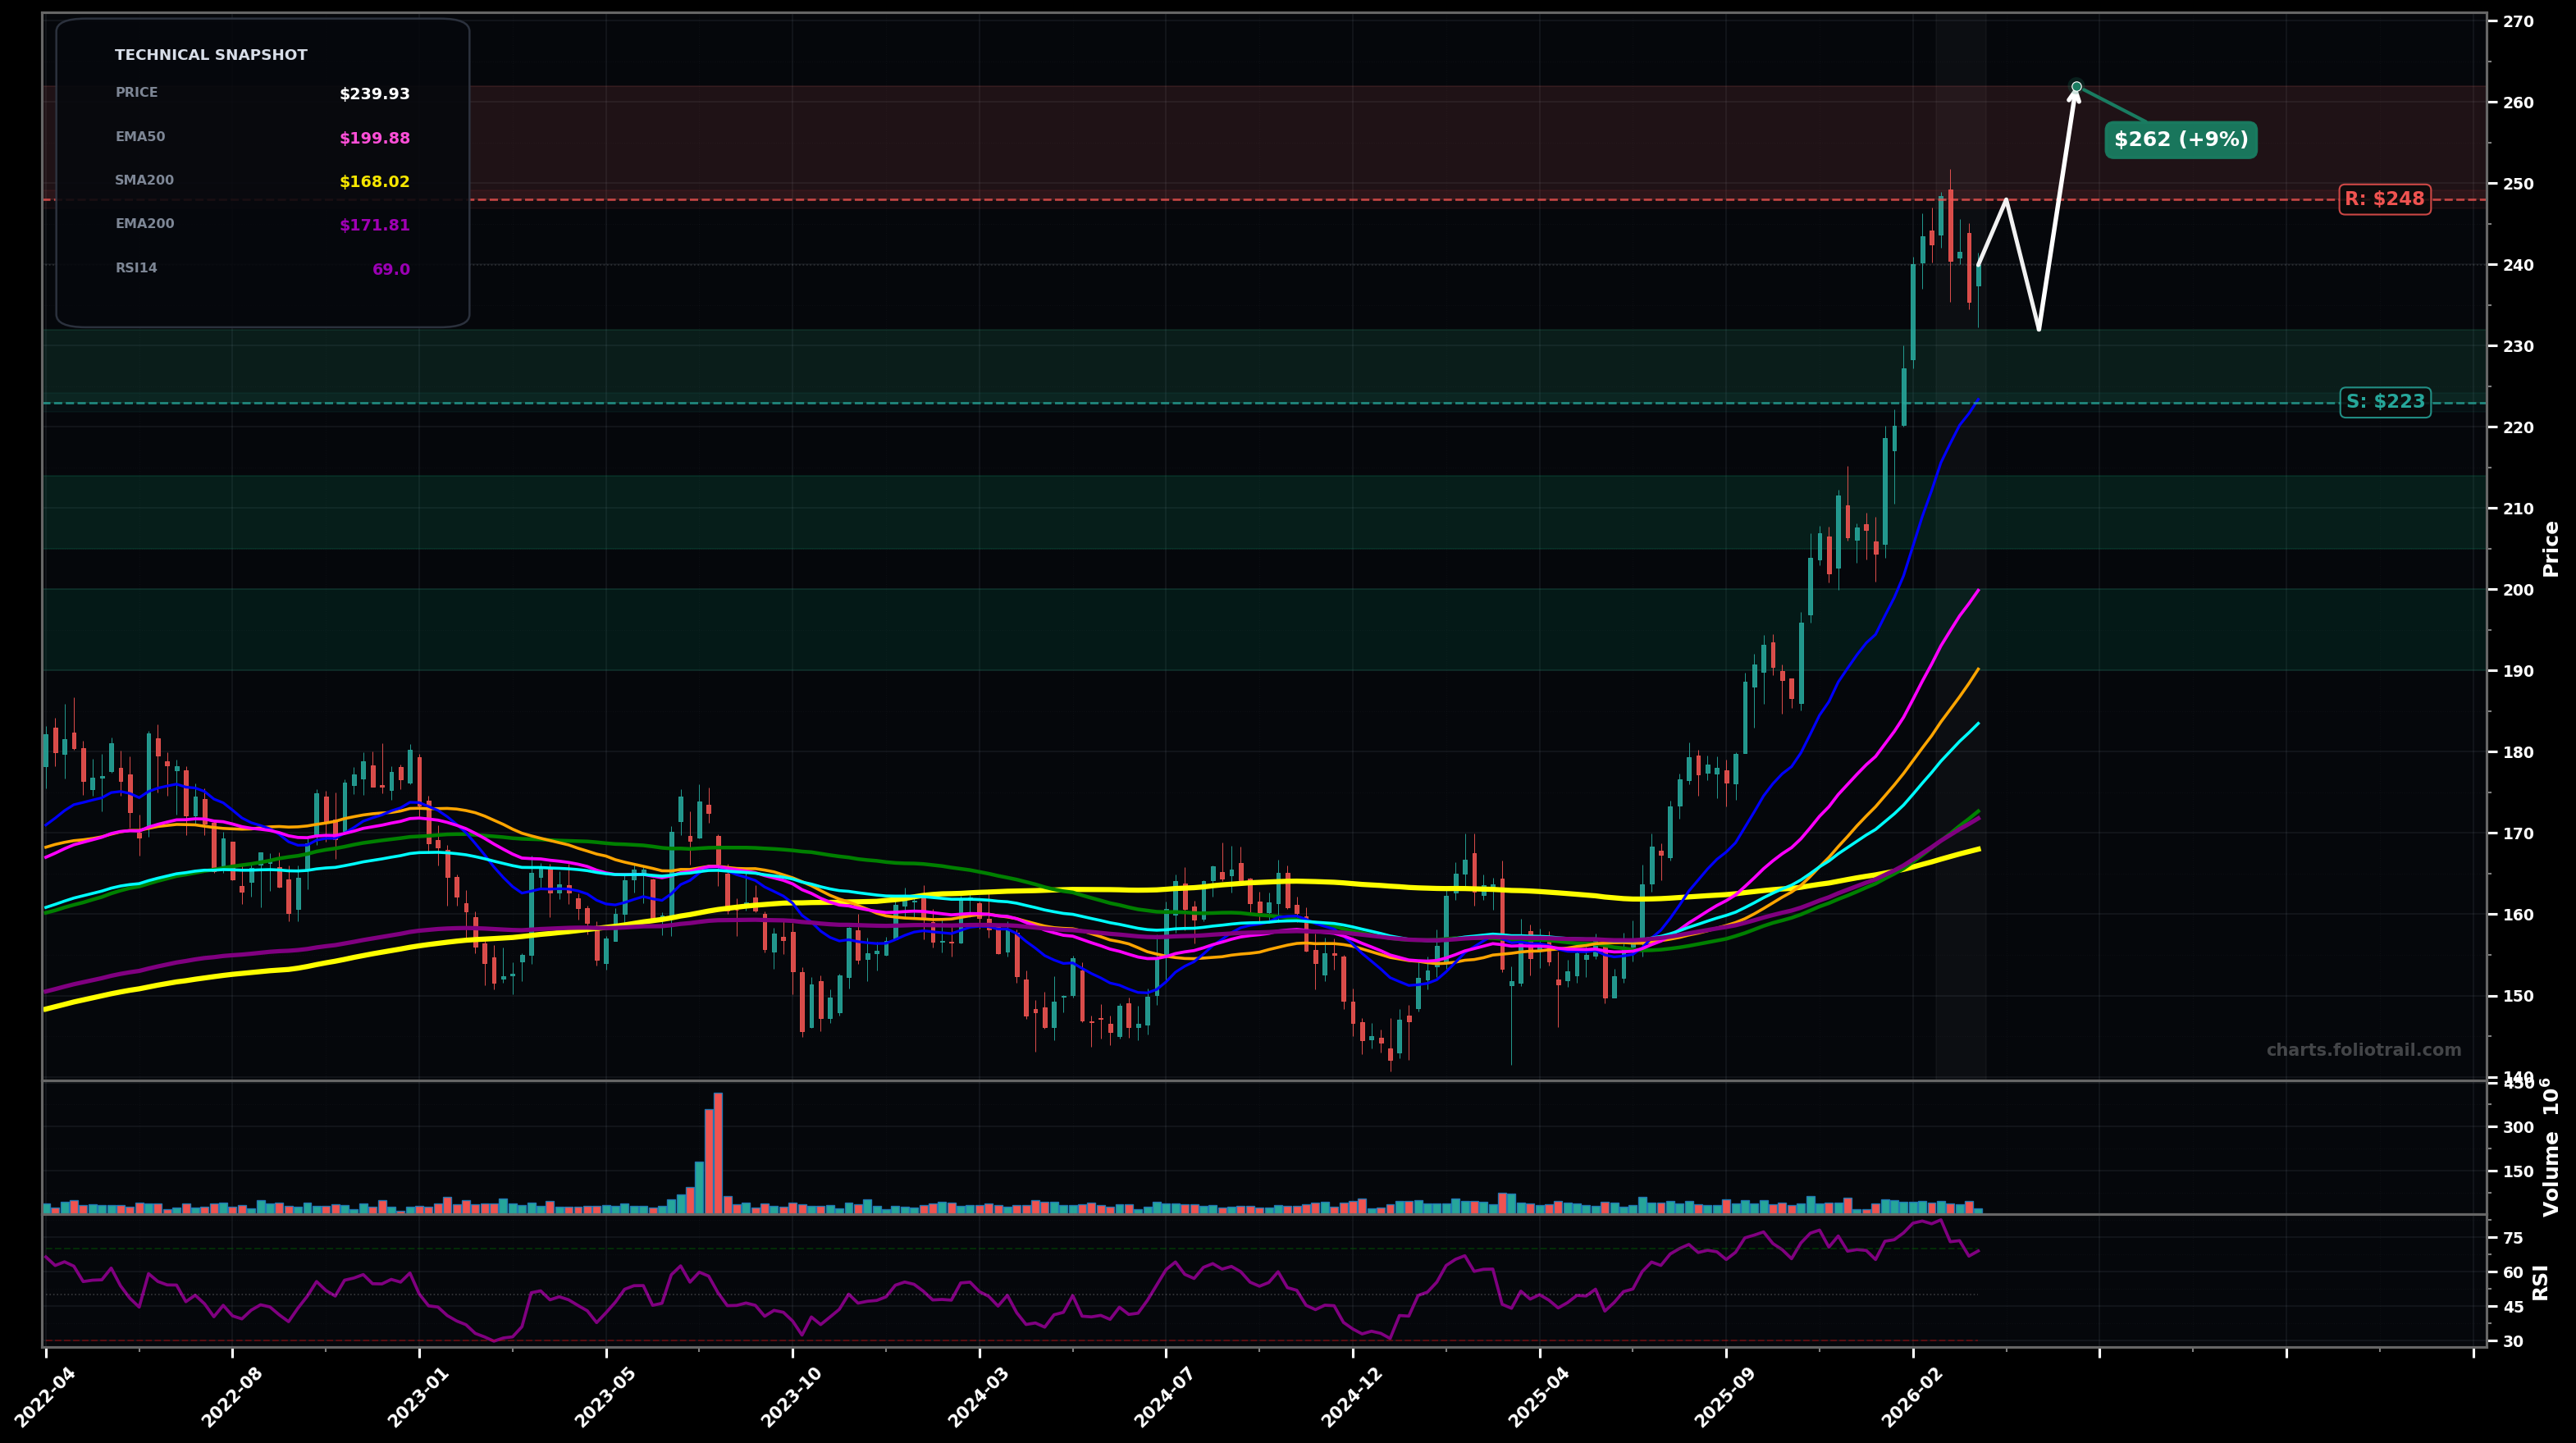
As of March 26, 2026, JNJ (Johnson & Johnson) is in a uptrend state on the weekly chart, with a confidence level of 72%. Key support is at $223 and key resistance at $248. Strong weekly uptrend from mid-2025 base; after a blow-off push to ~$248, price is pulling back to ~$240 while staying well above rising EMA50/EMA100; RSI ~69 (elevated but not extreme).
Bullish continuation after a controlled pullback: price consolidates above the breakout zone (~$223–$232), then retests the prior high and grinds to new highs (trend-follow through).
Deeper mean-reversion: weekly momentum cools and price retraces toward the rising EMA50 (~$200) before buyers reassert; this would look like an Elliott Wave 4-style pullback within a larger Wave 5/extension attempt.
Weekly close back above $248 would confirm continuation/impulse resumption.
Weekly close below $223 would invalidate the near-term uptrend structure (break under EMA20 area and prior breakout zone).
Start near prior breakout/EMA20 support ($223–$232); add on pullback toward rising EMA50/structure ($205–$214); heavy add on deeper mean-reversion into EMA50/SMA50 confluence (~$190–$200).
Trim into prior high/extension targets (possible Wave 5); heavier trims as price stretches further above EMA50/RSI stays elevated; full close if a multi-year extension runs toward ~$280–$300 (high risk of major mean-reversion).
As of March 26, 2026, JNJ (Johnson & Johnson) is in a uptrend state on the weekly chart with 72% confidence. Strong weekly uptrend from mid-2025 base; after a blow-off push to ~$248, price is pulling back to ~$240 while staying well above rising EMA50/EMA100; RSI ~69 (elevated but not extreme).
On the weekly timeframe, JNJ has key support at $223 and key resistance at $248. The most likely scenario (bullish) targets $248 and $262, with a revert level at $232.
JNJ (Johnson & Johnson) is currently classified as uptrend on the weekly chart, with 72% confidence. Confirmation requires: Weekly close back above $248 would confirm continuation/impulse resumption. This would be invalidated by: Weekly close below $223 would invalidate the near-term uptrend structure (break under EMA20 area and prior breakout zone).
The most likely scenario (bullish) targets $248 and $262, with a revert level at $232. The alternative scenario (bearish) targets $223 and $200.
Multi-layer AI agents analyse 200+ stocks across daily, weekly, and monthly timeframes — producing market state classifications, price scenarios with targets, and position entry/exit levels. Updated every trading day after market close. No paywall. No sign-up required.
Built by Foliotrail.
All content on this website — including charts, analysis, price targets, support/resistance levels, and position zones — is generated entirely by AI and provided for educational and informational purposes only.
This is not financial advice. NEXUSNOIR VENTURES SL (the operator of this website) is not a registered investment adviser or broker-dealer. You should not make investment decisions based solely on this information. Always do your own research and consult a qualified financial advisor.
By continuing, you acknowledge that you have read and agree to our full disclaimer & terms of use and privacy policy.