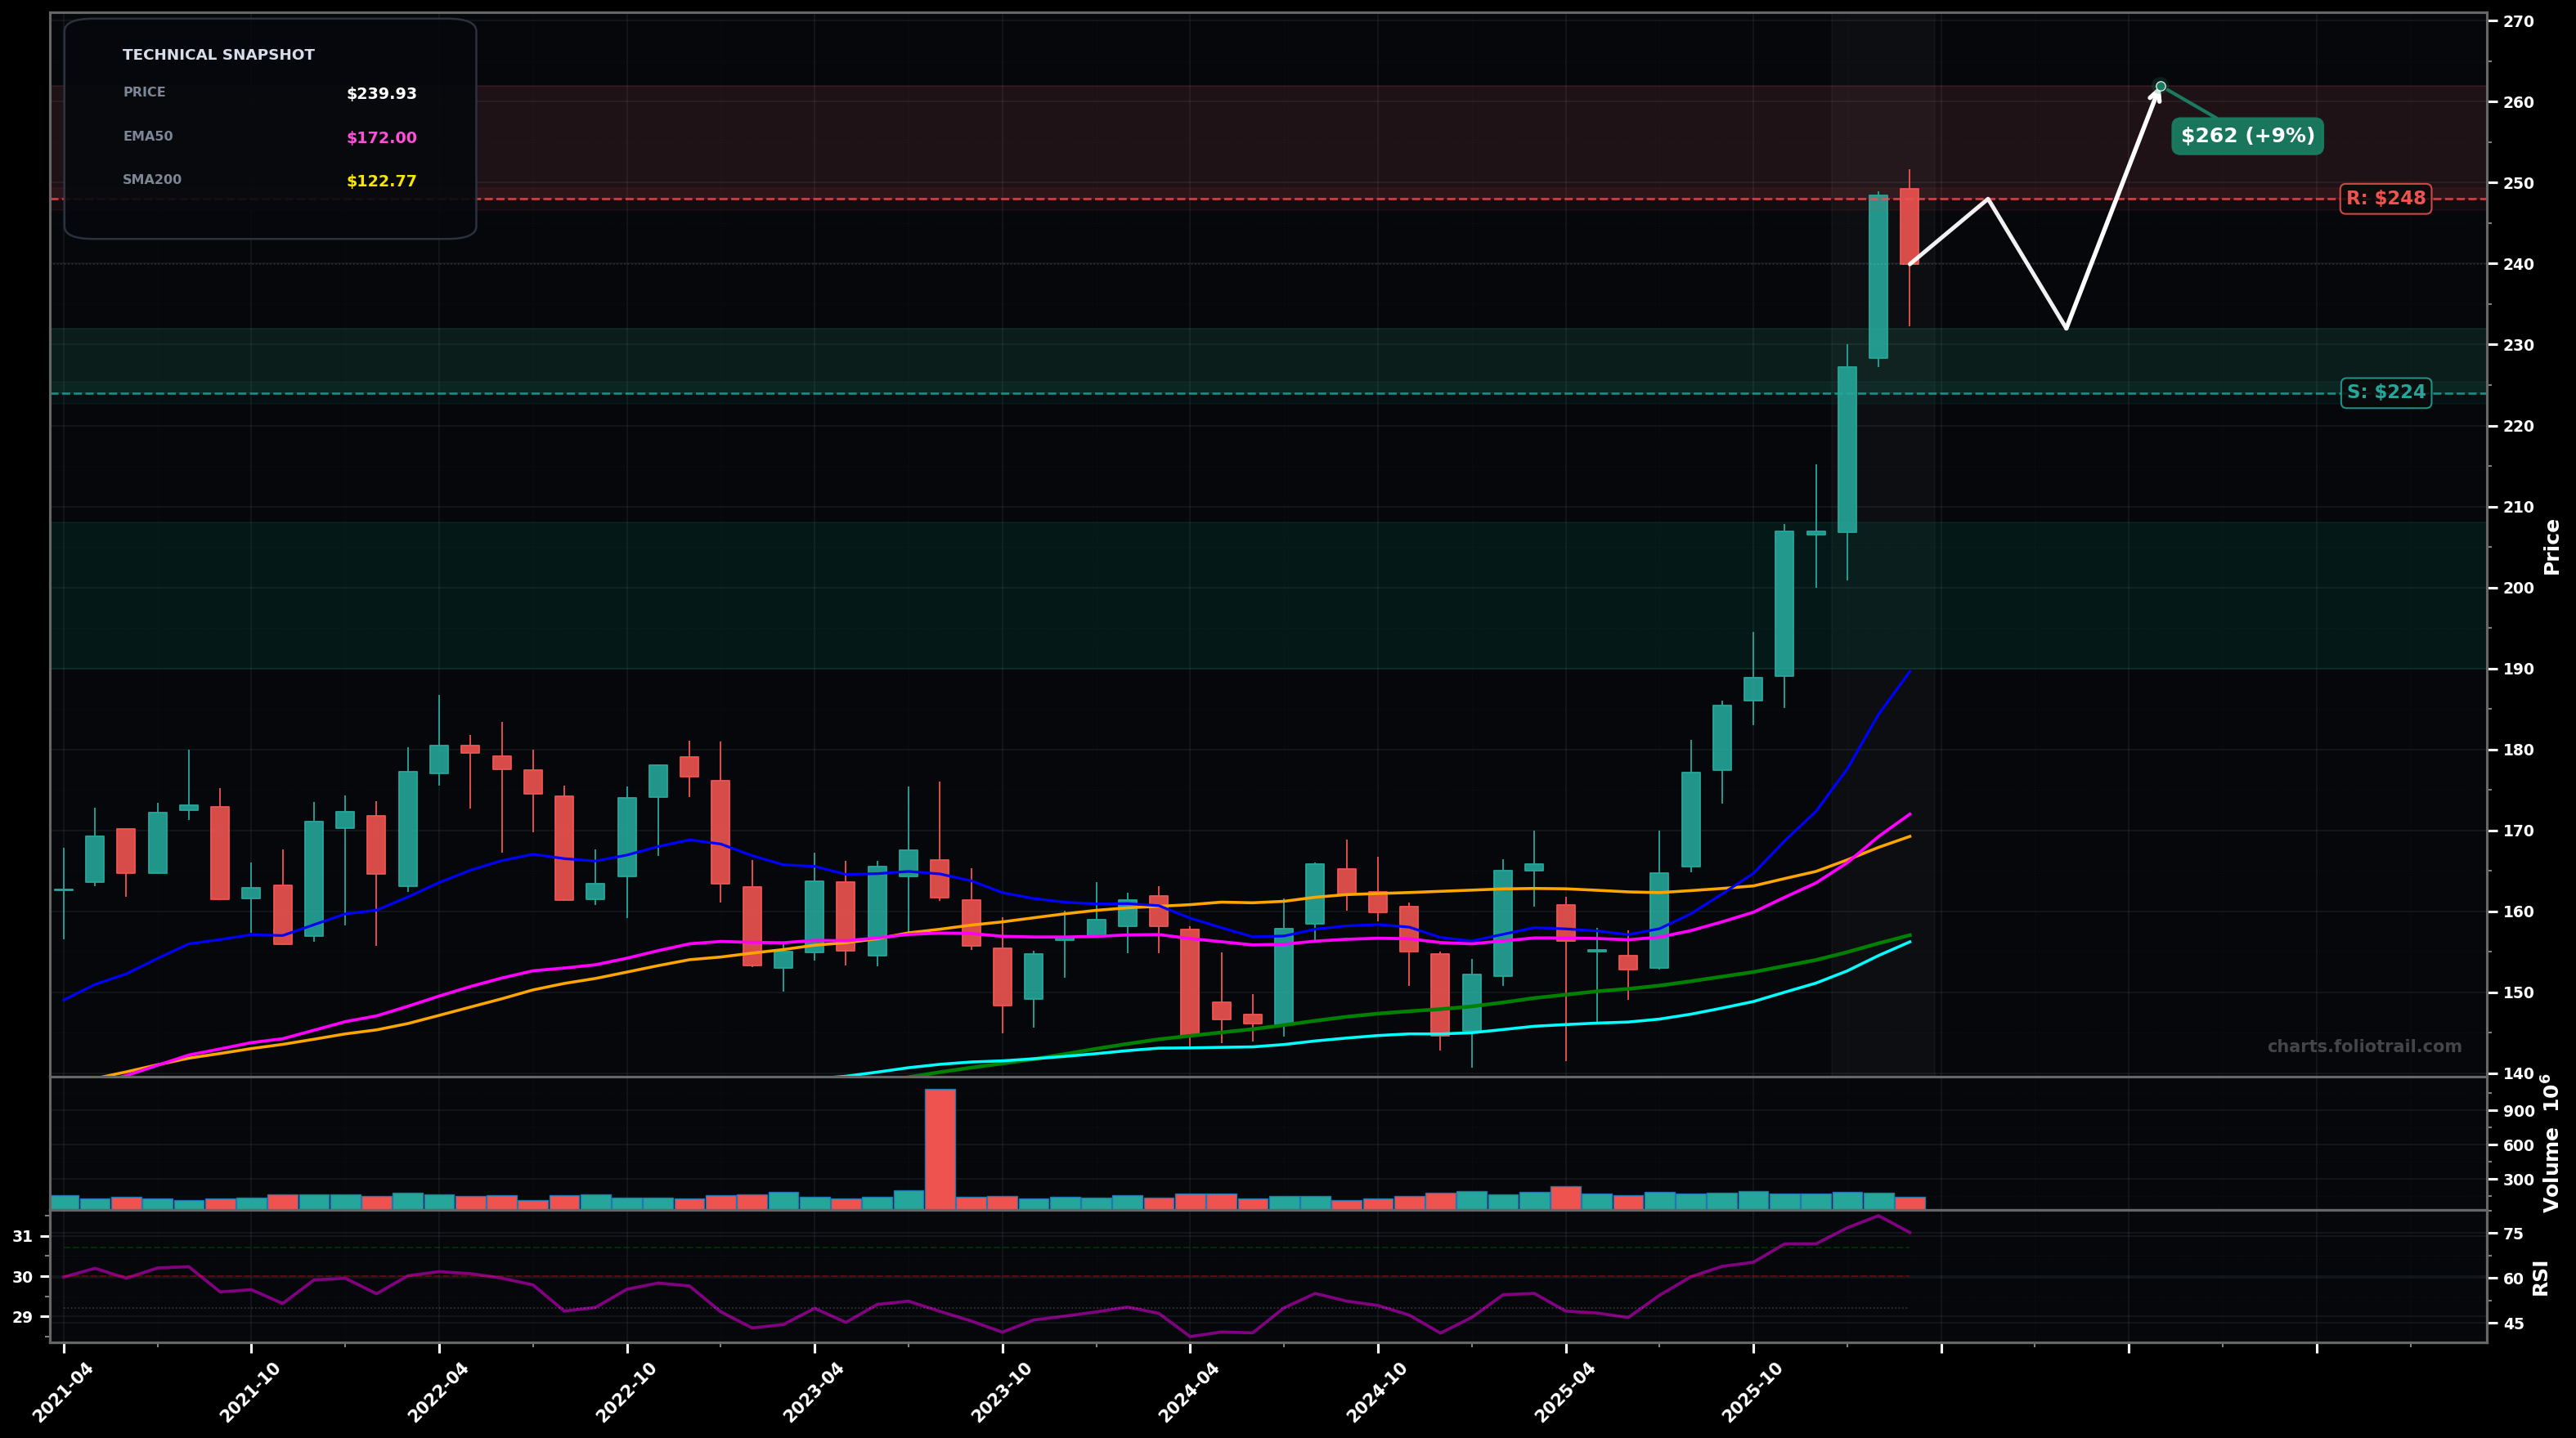
As of March 26, 2026, JNJ (Johnson & Johnson) is in a parabolic state on the monthly chart, with a confidence level of 73%. Key support is at $224 and key resistance at $248. Strong breakout/impulse from a long range; vertical advance into ~$240s with first notable pullback candle; RSI(14) ~75 (overbought).
Bullish continuation but choppy: a brief consolidation/pullback holds above prior breakout zone, then a push to new highs (likely Elliott Wave 5 extension after a strong Wave 3/3-of-3 type thrust).
Mean-reversion: momentum cools and price retraces toward the fast MAs/old range top (parabolic unwind), then attempts a higher low base (Wave 4 style correction) before the next advance attempt.
Monthly close above $248
Monthly close below $224
Buy-the-dip tiers around prior breakout/round-number support ($232-$224), then deeper Fib-style retrace into prior structure ($208), with heavy adds only if a larger Wave-4 retrace tags the ~$200 area while still above long-term MAs.
Trim into strength near the current swing-extension zone ($248-$262) and progressively more into a potential blow-off extension ($262-$280+); full exit reserved only for extreme multi-year stretch/blow-off conditions ($280-$300).
As of March 26, 2026, JNJ (Johnson & Johnson) is in a parabolic state on the monthly chart with 73% confidence. Strong breakout/impulse from a long range; vertical advance into ~$240s with first notable pullback candle; RSI(14) ~75 (overbought).
On the monthly timeframe, JNJ has key support at $224 and key resistance at $248. The most likely scenario (bullish) targets $248 and $262, with a revert level at $232.
JNJ (Johnson & Johnson) is currently classified as parabolic on the monthly chart, with 73% confidence. Confirmation requires: Monthly close above $248 This would be invalidated by: Monthly close below $224
The most likely scenario (bullish) targets $248 and $262, with a revert level at $232. The alternative scenario (bearish) targets $224 and $208.
Multi-layer AI agents analyse 200+ stocks across daily, weekly, and monthly timeframes — producing market state classifications, price scenarios with targets, and position entry/exit levels. Updated every trading day after market close. No paywall. No sign-up required.
Built by Foliotrail.
All content on this website — including charts, analysis, price targets, support/resistance levels, and position zones — is generated entirely by AI and provided for educational and informational purposes only.
This is not financial advice. NEXUSNOIR VENTURES SL (the operator of this website) is not a registered investment adviser or broker-dealer. You should not make investment decisions based solely on this information. Always do your own research and consult a qualified financial advisor.
By continuing, you acknowledge that you have read and agree to our full disclaimer & terms of use and privacy policy.