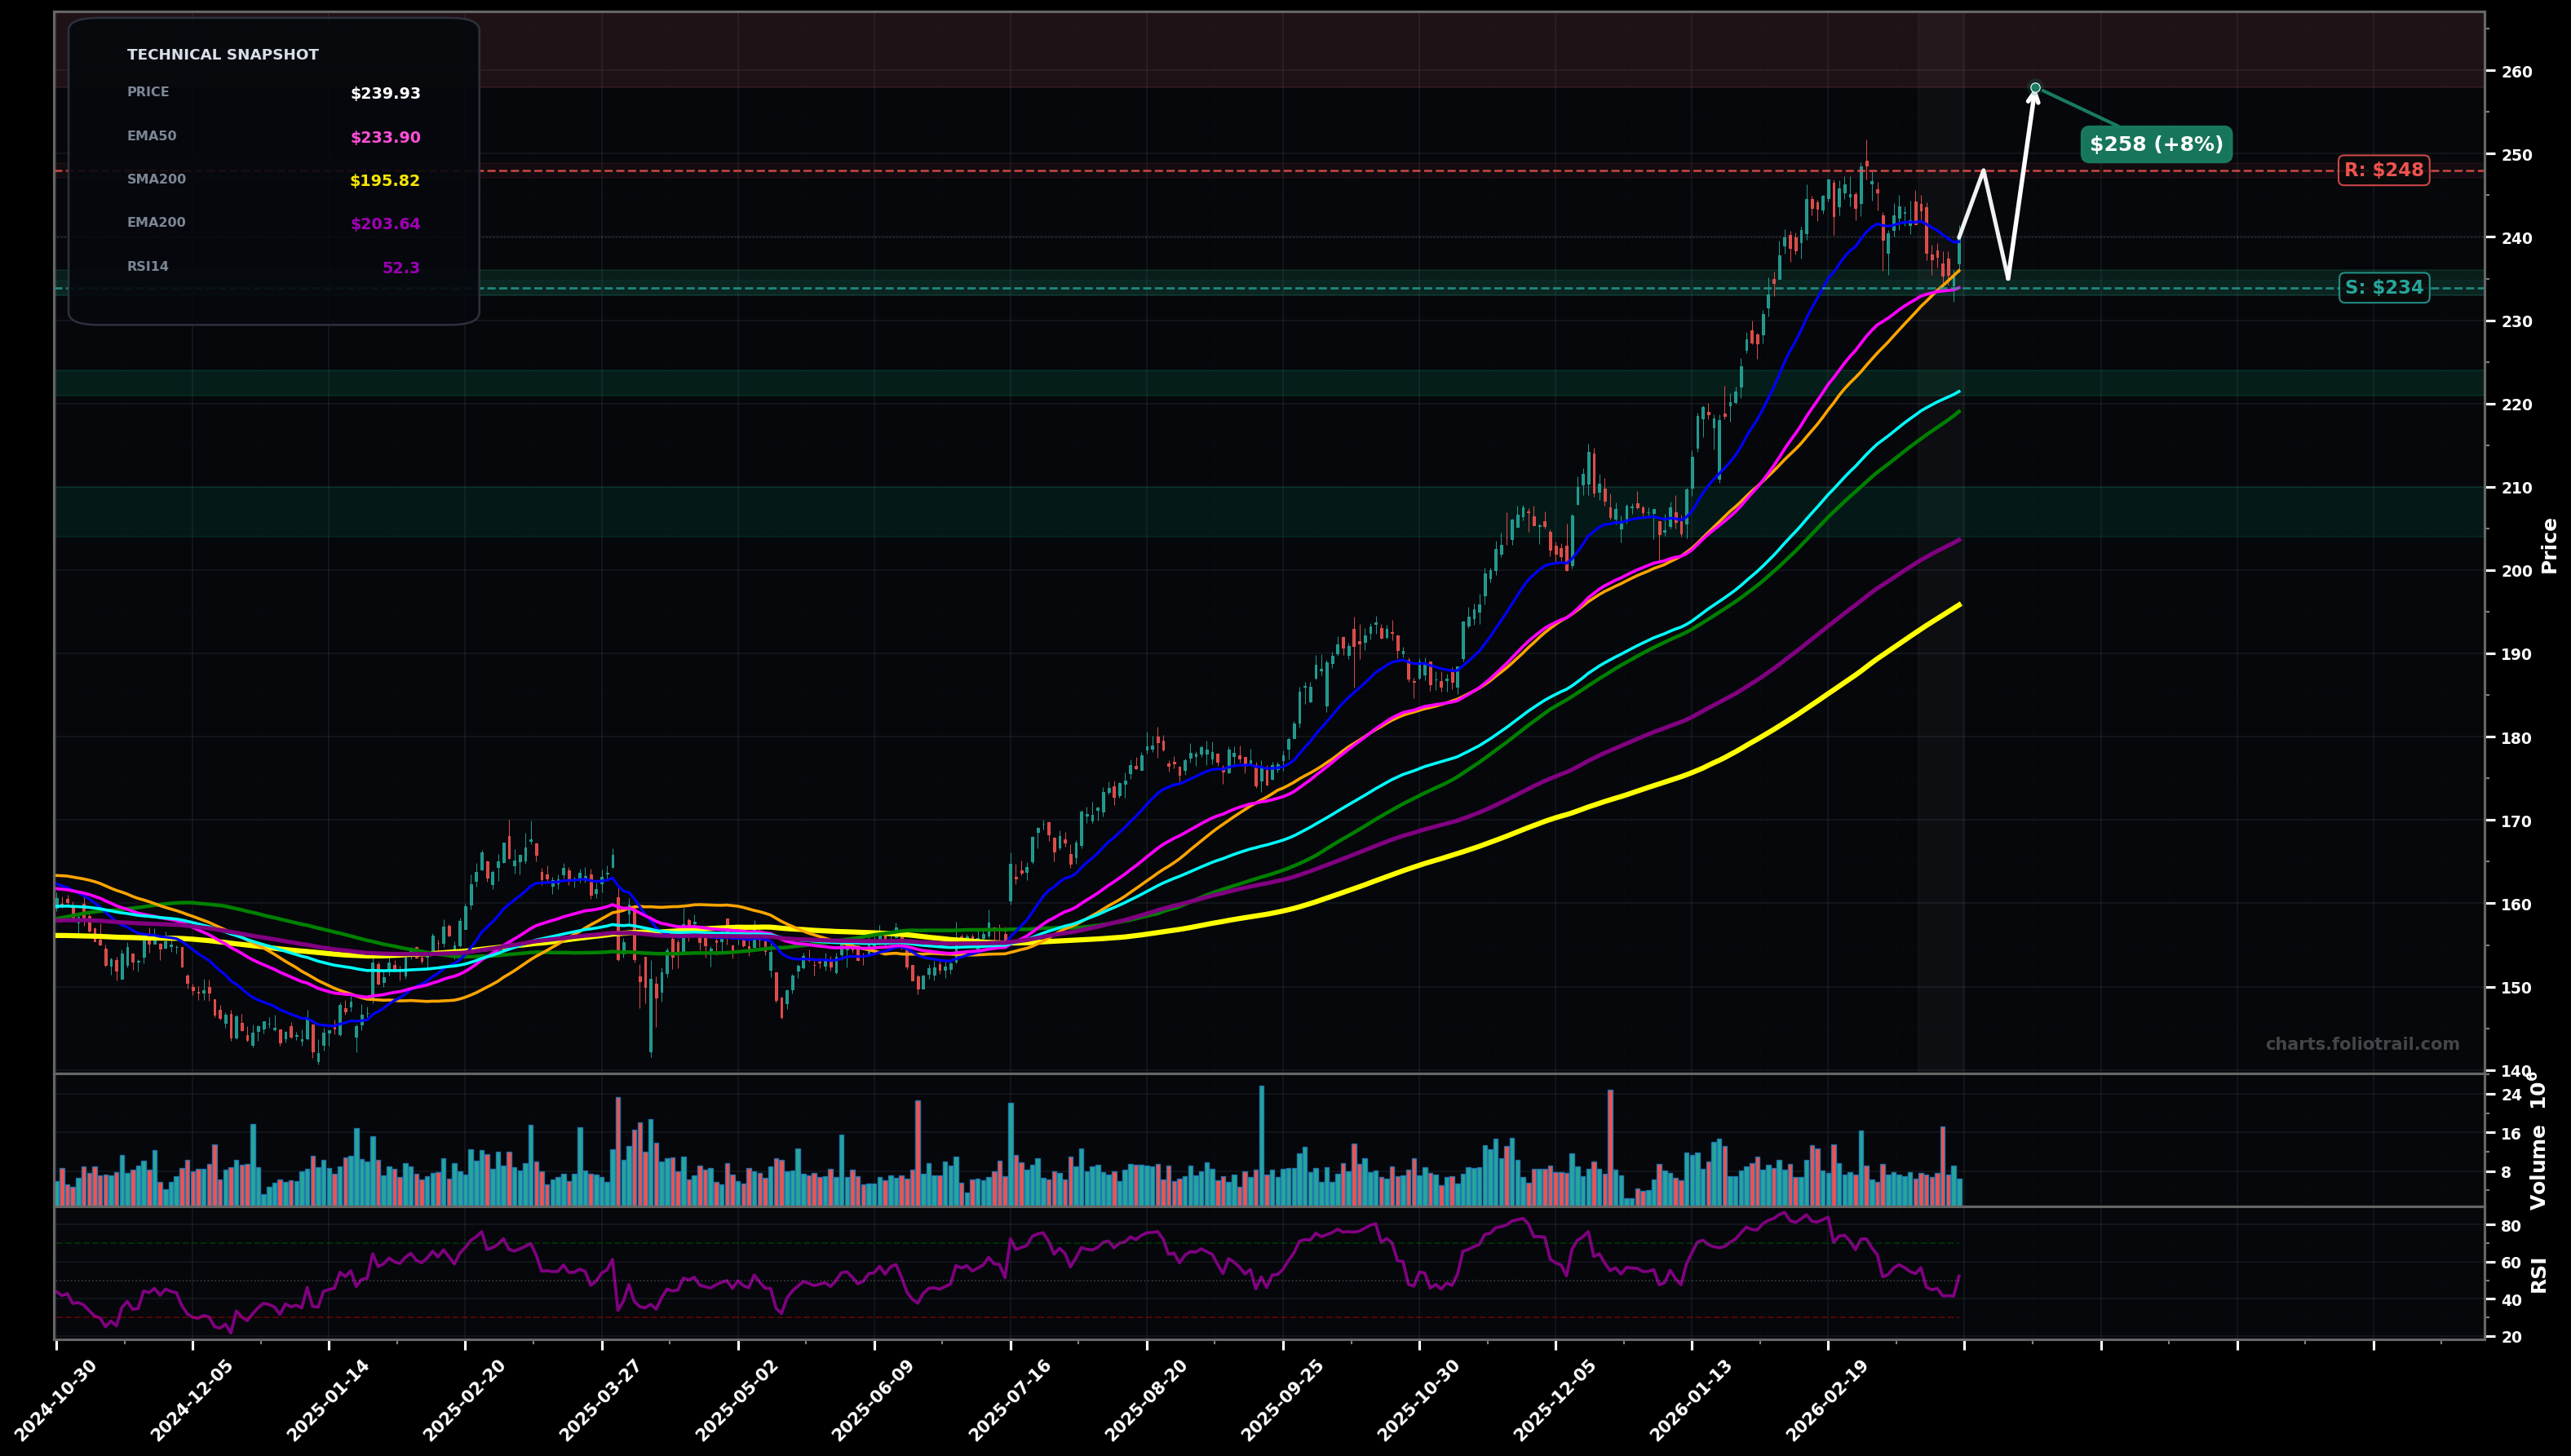
As of March 26, 2026, JNJ (Johnson & Johnson) is in a uptrend state on the daily chart, with a confidence level of 67%. Key support is at $234 and key resistance at $248. Price ~$239.93 pulled back from the ~$248 swing high and is trying to hold the rising EMA50 (~$233.90) with RSI ~52 (cooling, not oversold).
Bullish continuation: pullback completes as an ABC / wave (4) style correction near EMA50, then wave (5) attempts a retest/break of the $248 high.
Bearish deeper retrace: loss of EMA50 leads to a drop into the EMA100/SMA100 confluence; this would fit a larger wave (4) retracement toward the prior breakout zone (Fib ~38.2–50% of the last impulse leg).
Daily close above $242 with follow-through (2+ closes) would confirm trend continuation toward the highs.
Daily close below $233 would invalidate the near-term uptrend control and favor a deeper correction toward $221.
Start at EMA50 reclaim/hold; add at EMA100/SMA100 support cluster; heavy add near EMA200 (~$203.64) where trend-support typically attracts longer-term demand.
Trim into new highs/extensions (potential Fib 1.272–1.618 from the last pullback) as price gets increasingly stretched above rising EMA50; close only if a multi-year extension forms and momentum becomes frothy.
As of March 26, 2026, JNJ (Johnson & Johnson) is in a uptrend state on the daily chart with 67% confidence. Price ~$239.93 pulled back from the ~$248 swing high and is trying to hold the rising EMA50 (~$233.90) with RSI ~52 (cooling, not oversold).
On the daily timeframe, JNJ has key support at $234 and key resistance at $248. The most likely scenario (bullish) targets $248 and $258, with a revert level at $235.
JNJ (Johnson & Johnson) is currently classified as uptrend on the daily chart, with 67% confidence. Confirmation requires: Daily close above $242 with follow-through (2+ closes) would confirm trend continuation toward the highs. This would be invalidated by: Daily close below $233 would invalidate the near-term uptrend control and favor a deeper correction toward $221.
The most likely scenario (bullish) targets $248 and $258, with a revert level at $235. The alternative scenario (bearish) targets $222 and $214.
Multi-layer AI agents analyse 200+ stocks across daily, weekly, and monthly timeframes — producing market state classifications, price scenarios with targets, and position entry/exit levels. Updated every trading day after market close. No paywall. No sign-up required.
Built by Foliotrail.
All content on this website — including charts, analysis, price targets, support/resistance levels, and position zones — is generated entirely by AI and provided for educational and informational purposes only.
This is not financial advice. NEXUSNOIR VENTURES SL (the operator of this website) is not a registered investment adviser or broker-dealer. You should not make investment decisions based solely on this information. Always do your own research and consult a qualified financial advisor.
By continuing, you acknowledge that you have read and agree to our full disclaimer & terms of use and privacy policy.