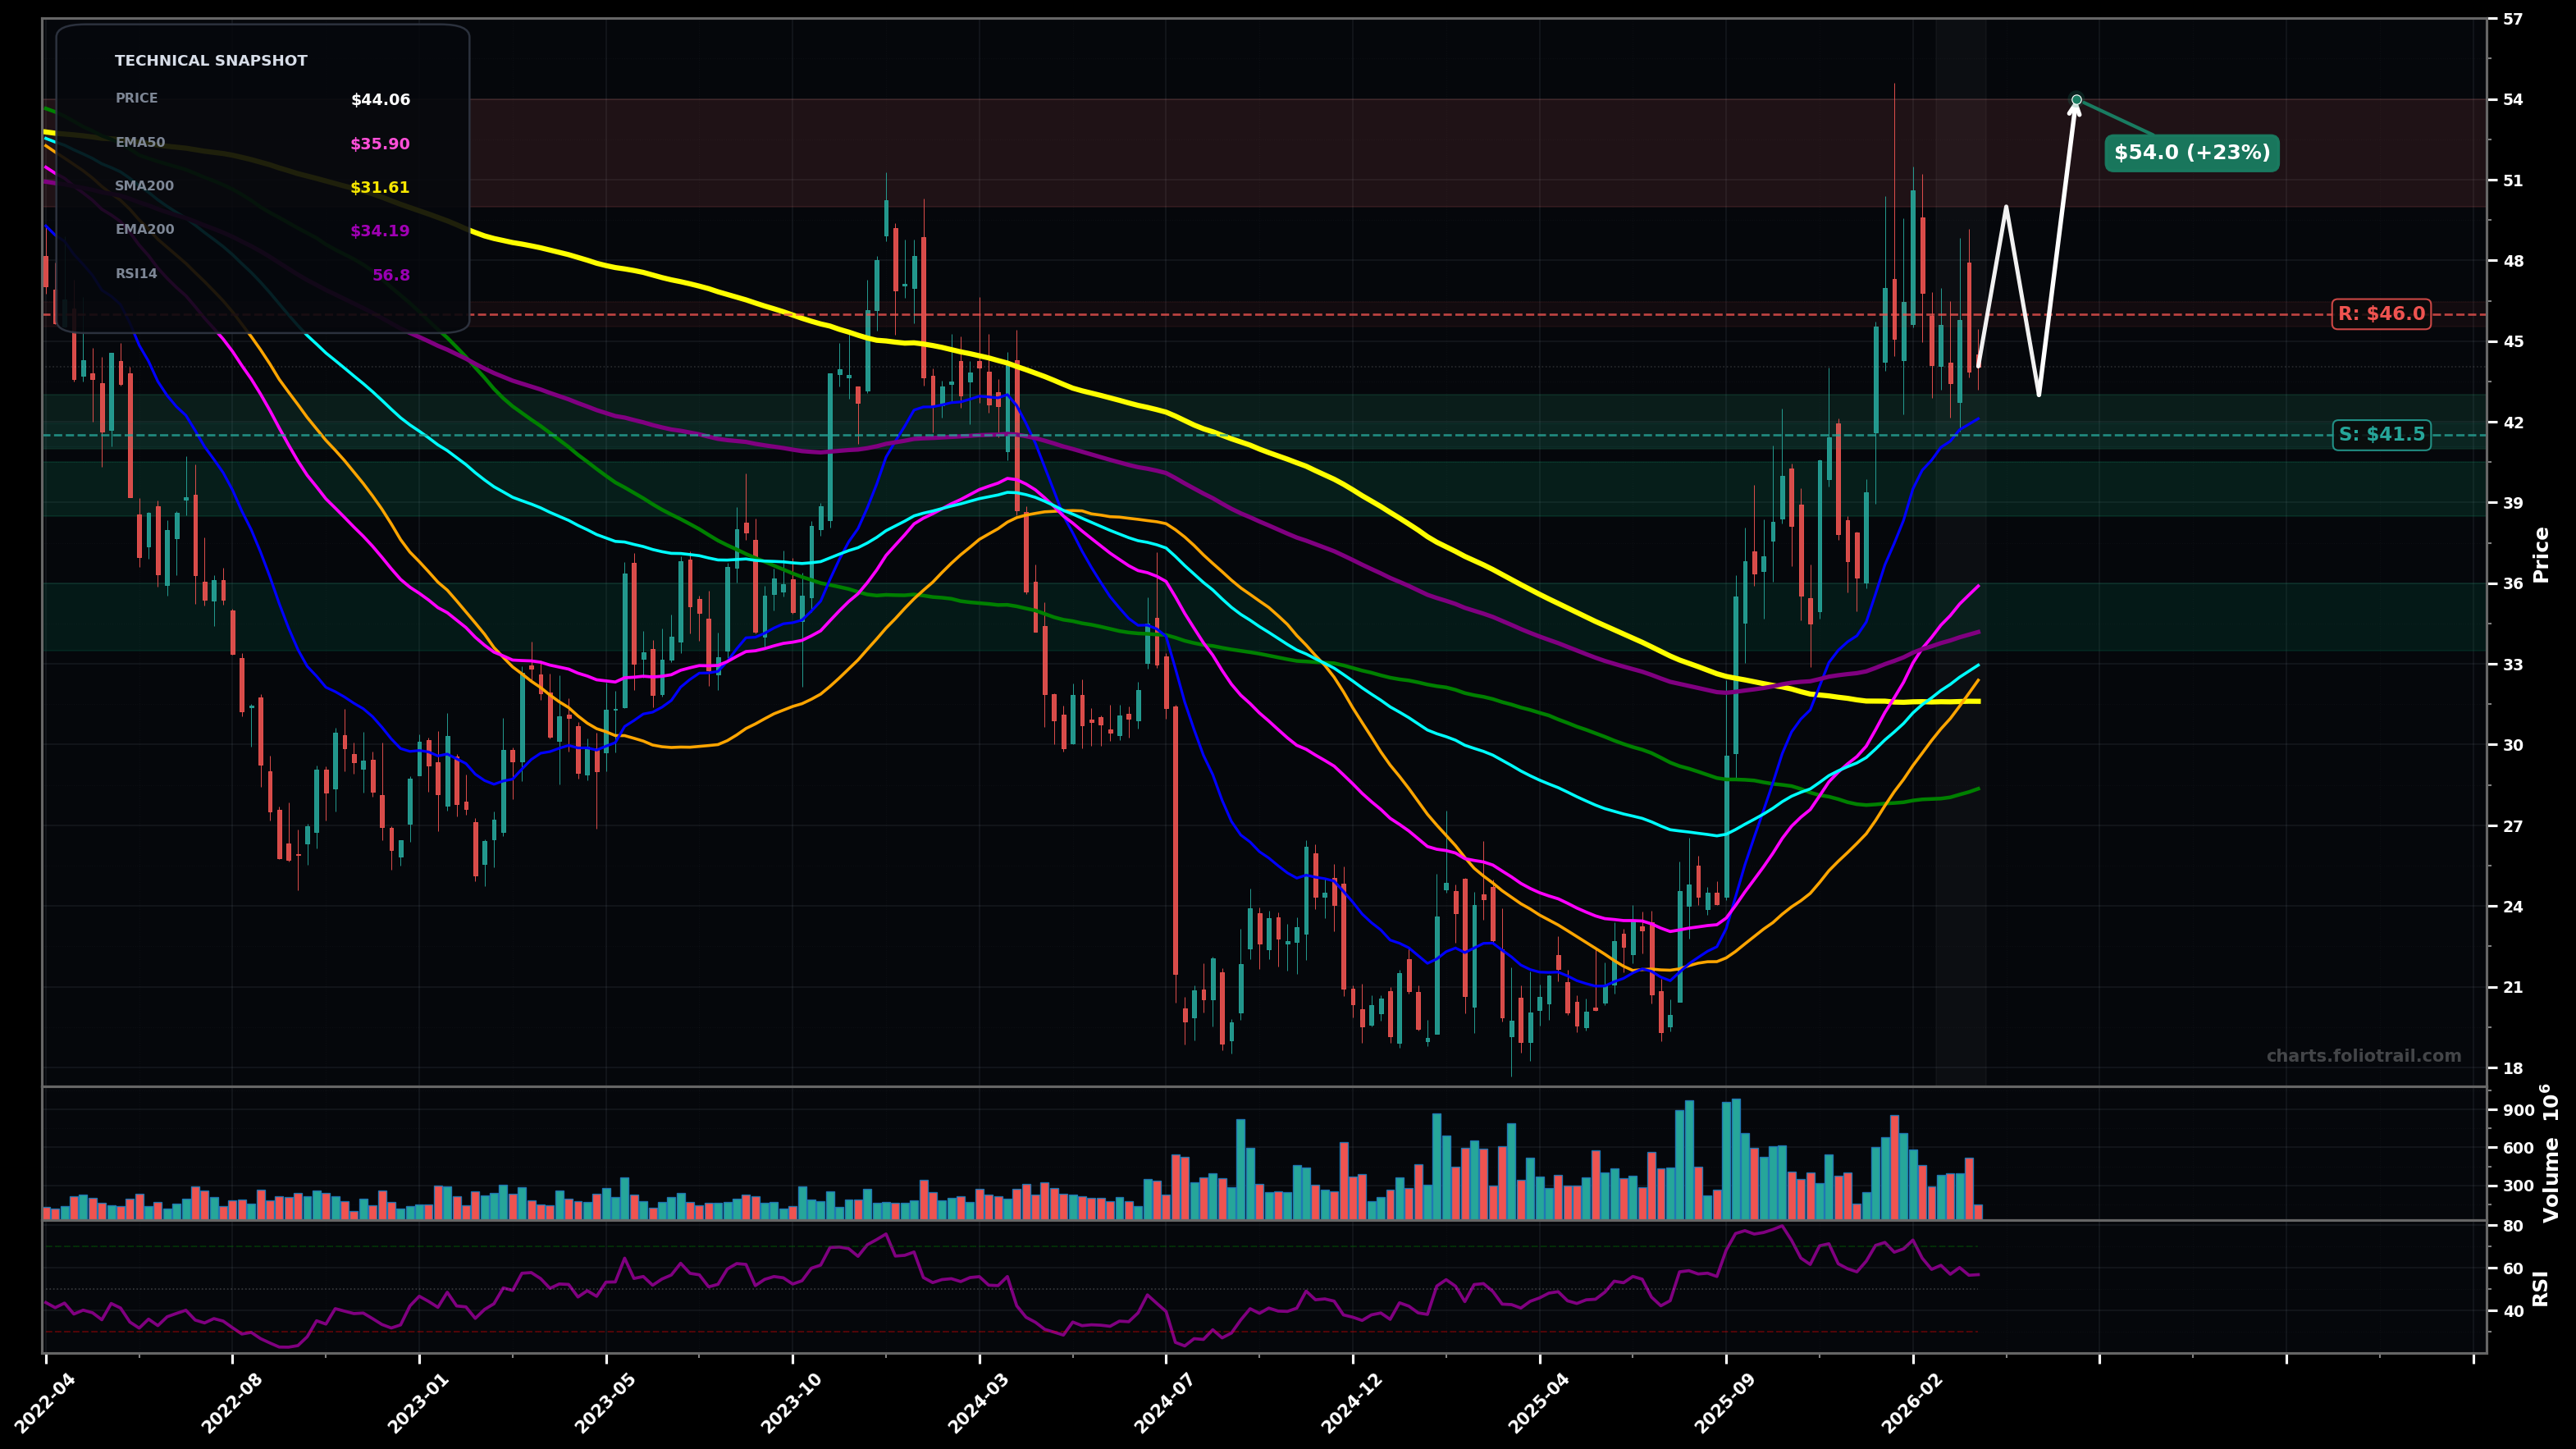
As of March 25, 2026, INTC (Intel Corporation) is in a uptrend state on the weekly chart, with a confidence level of 68%. Key support is at $41.5 and key resistance at $46.0. Weekly pullback after a strong rally; price (~$44) is digesting gains below the recent peak (~$50) while still holding above rising faster MAs.
Bullish continuation: pullback completes as a Wave 4-type consolidation; price holds the $41-$42 area and resumes the primary advance (Wave 5) toward the prior high, with a brief retest of reclaimed MAs possible.
Deeper correction: the post-peak move evolves into an ABC pullback toward the 38.2%–50% retrace of the mid-2025 to peak leg; price loses $41-$42 and mean-reverts to the EMA100/EMA200 cluster before attempting to base.
Weekly close back above $46.00 (and holding) would confirm trend continuation toward prior highs.
Weekly close below $39.50 would invalidate the near-term uptrend structure (break of key swing support/EMA zone).
Start near prior breakout/EMA50 support; add on a clean pullback into EMA100 + prior structure; heavy add near EMA200/SMA200 region and ~50%+ retrace where higher-timeframe demand previously appeared.
Trim into prior-high breakout and likely Fib extensions (1.0–1.272); heavier trims into 1.618-extension/overextension vs long MAs; close if price becomes multi-year stretched far above EMA200/SMA200.
As of March 25, 2026, INTC (Intel Corporation) is in a uptrend state on the weekly chart with 68% confidence. Weekly pullback after a strong rally; price (~$44) is digesting gains below the recent peak (~$50) while still holding above rising faster MAs.
On the weekly timeframe, INTC has key support at $41.5 and key resistance at $46.0. The most likely scenario (bullish) targets $50.0 and $54.0, with a revert level at $43.0.
INTC (Intel Corporation) is currently classified as uptrend on the weekly chart, with 68% confidence. Confirmation requires: Weekly close back above $46.00 (and holding) would confirm trend continuation toward prior highs. This would be invalidated by: Weekly close below $39.50 would invalidate the near-term uptrend structure (break of key swing support/EMA zone).
The most likely scenario (bullish) targets $50.0 and $54.0, with a revert level at $43.0. The alternative scenario (bearish) targets $39.5 and $35.0.
Multi-layer AI agents analyse 200+ stocks across daily, weekly, and monthly timeframes — producing market state classifications, price scenarios with targets, and position entry/exit levels. Updated every trading day after market close. No paywall. No sign-up required.
Built by Foliotrail.
All content on this website — including charts, analysis, price targets, support/resistance levels, and position zones — is generated entirely by AI and provided for educational and informational purposes only.
This is not financial advice. NEXUSNOIR VENTURES SL (the operator of this website) is not a registered investment adviser or broker-dealer. You should not make investment decisions based solely on this information. Always do your own research and consult a qualified financial advisor.
By continuing, you acknowledge that you have read and agree to our full disclaimer & terms of use and privacy policy.