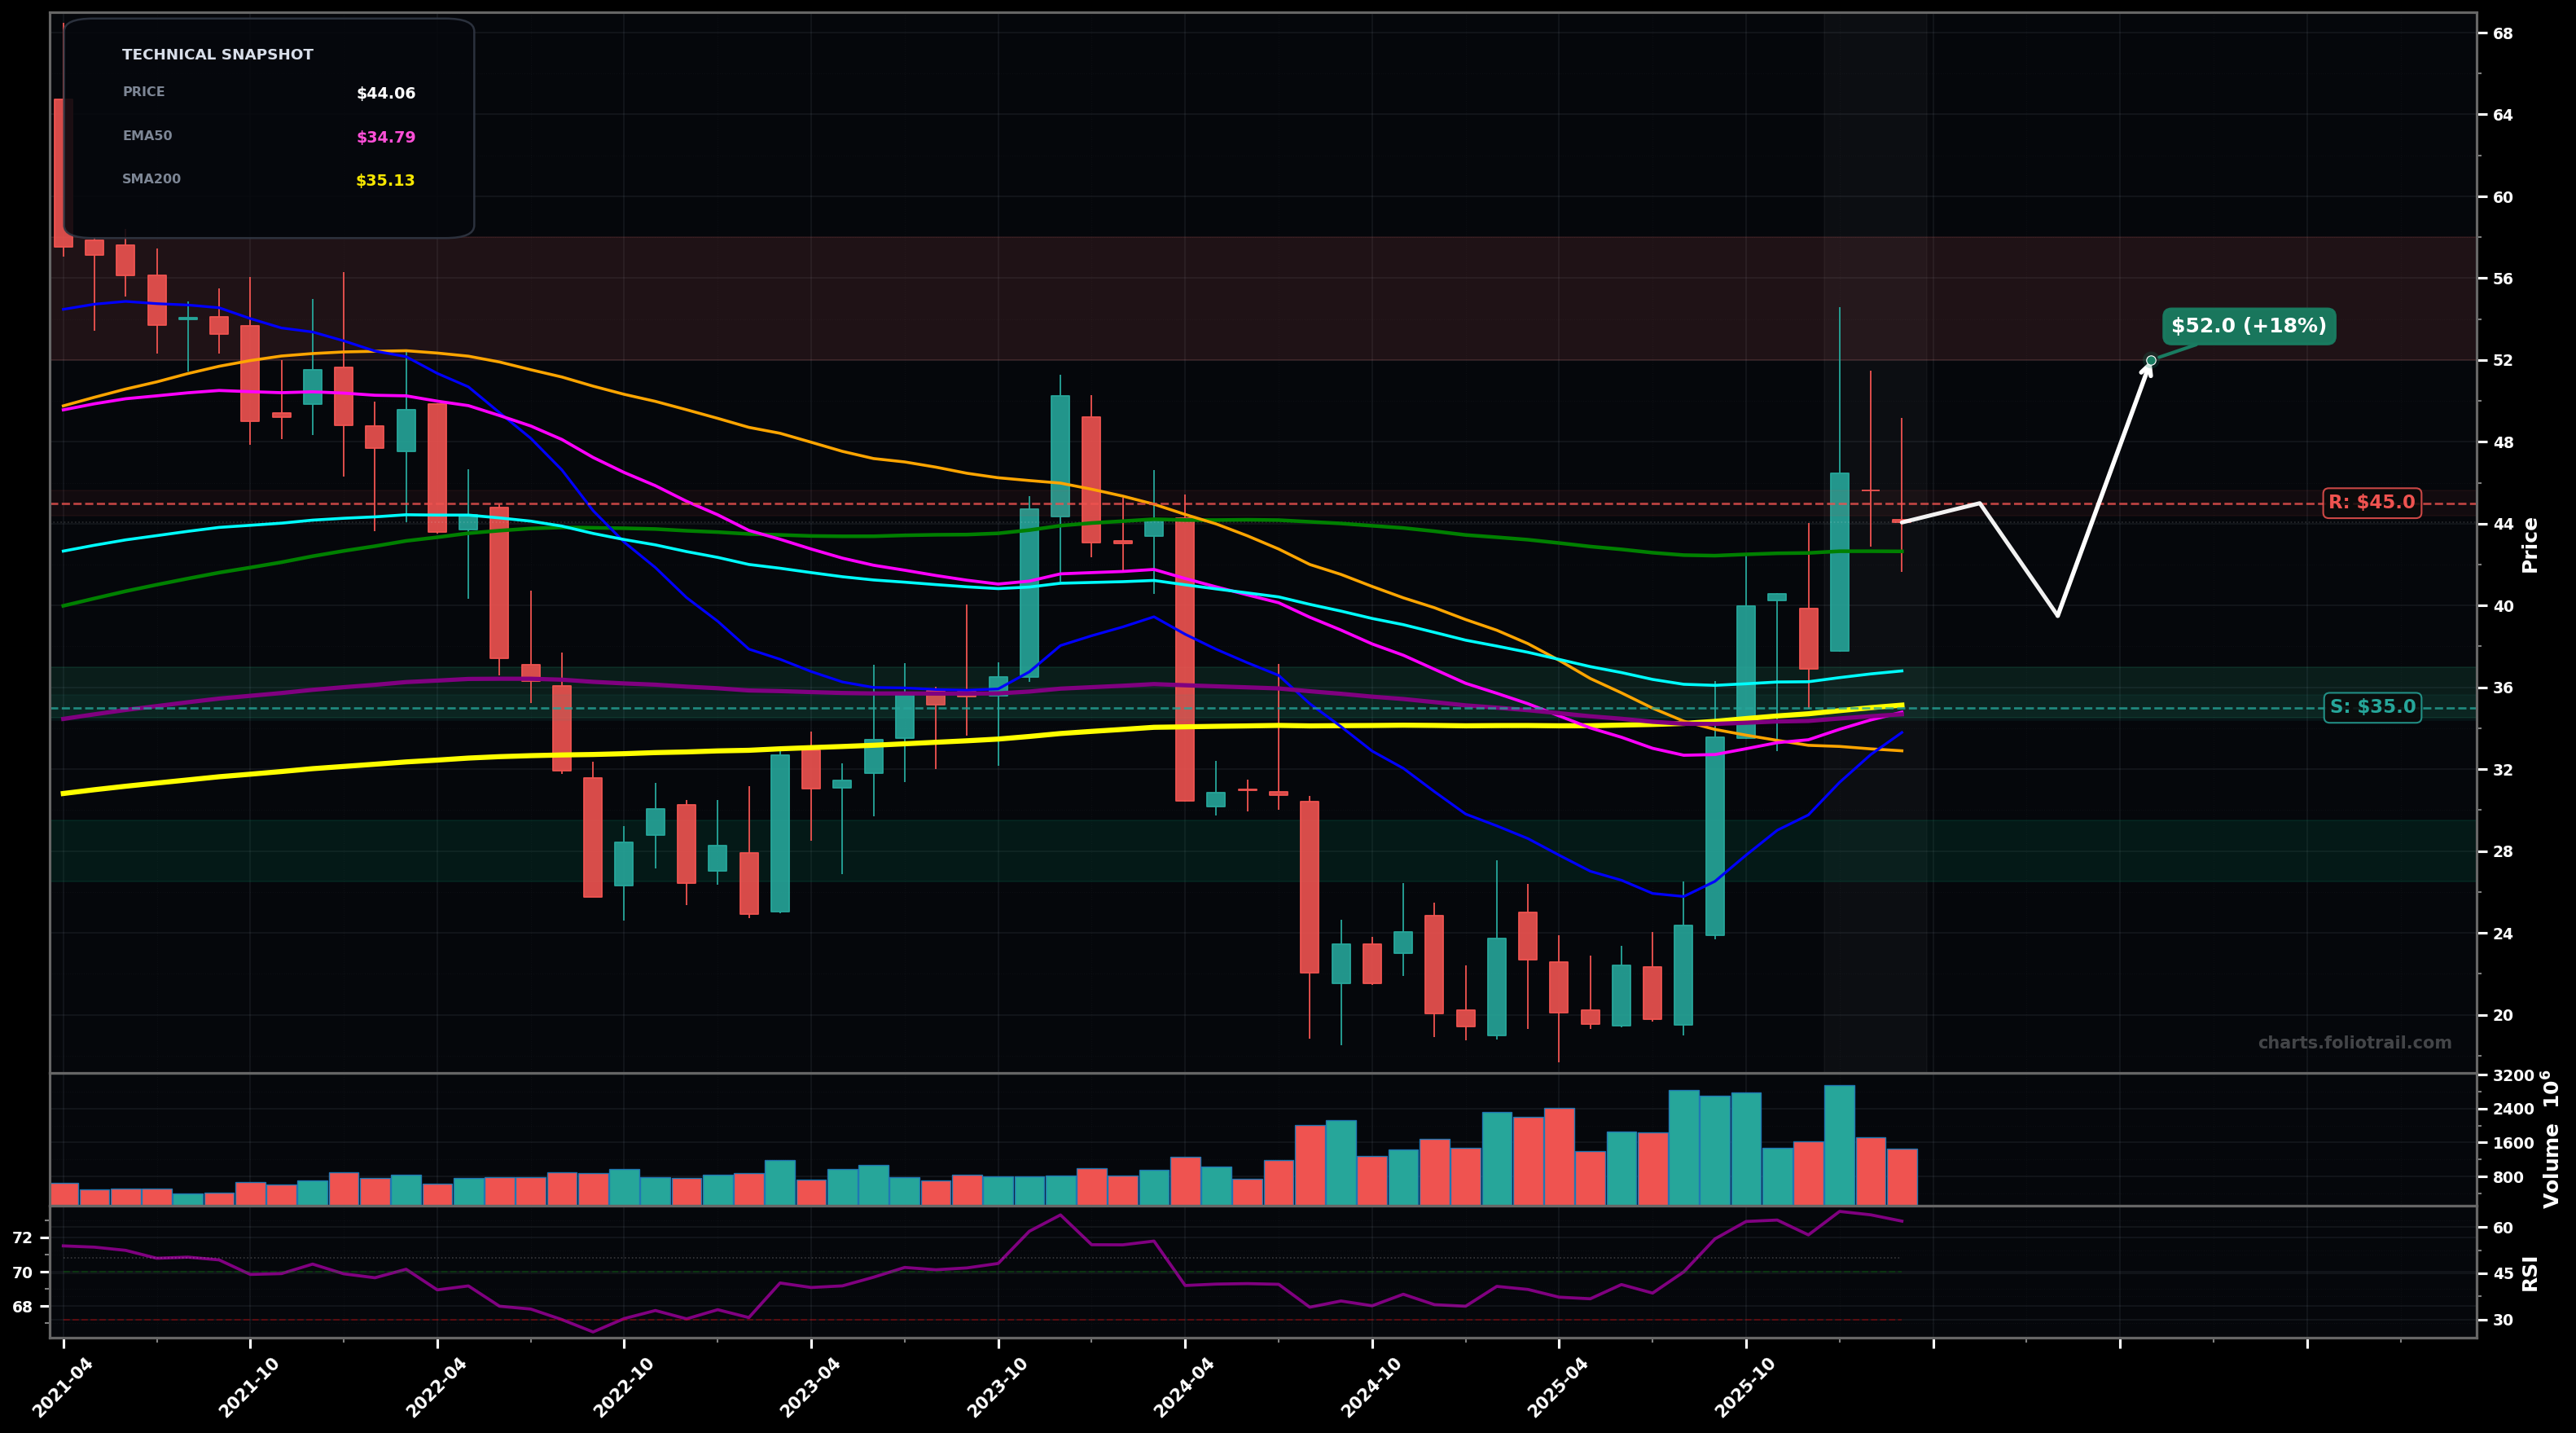
As of March 25, 2026, INTC (Intel Corporation) is in a breakout reversal state on the monthly chart, with a confidence level of 63%. Key support is at $35.0 and key resistance at $45.0. Strong multi-month rebound from the $19–$22 base, now stalling/pulling back near the major $44–$45 supply (SMA100) after an overbought push.
Base-to-up continuation: price consolidates above the $35 area (MA cluster) then grinds higher, eventually breaking $45 and retesting it as support (wave (3) style continuation). Rough probability 60%.
Failed breakout/rejection: inability to reclaim $45 triggers a deeper pullback into the MA cluster; if that breaks, price revisits the prior demand zone (ABC correction toward wave (2) support). Rough probability 40%.
Monthly close above $45.00 followed by another close holding above $45.00
Monthly close back below $34.50 (loss of EMA200/SMA200 cluster)
Buy-the-dip zones align with EMA200/SMA200 confluence (~$35), then prior structure, with heavy add at the next major demand/swing-support band (~$27–$29) if scenario 2 plays out.
Trim into major overhead supply from prior monthly pivots and typical Fibonacci extension behavior after a base breakout (first $52–$58, then $60–$68, with full exit if a multi-year stretched move reaches $70–$80).
As of March 25, 2026, INTC (Intel Corporation) is in a breakout reversal state on the monthly chart with 63% confidence. Strong multi-month rebound from the $19–$22 base, now stalling/pulling back near the major $44–$45 supply (SMA100) after an overbought push.
On the monthly timeframe, INTC has key support at $35.0 and key resistance at $45.0. The most likely scenario (bullish) targets $45.0 and $52.0, with a revert level at $39.5.
INTC (Intel Corporation) is currently classified as breakout reversal on the monthly chart, with 63% confidence. Confirmation requires: Monthly close above $45.00 followed by another close holding above $45.00 This would be invalidated by: Monthly close back below $34.50 (loss of EMA200/SMA200 cluster)
The most likely scenario (bullish) targets $45.0 and $52.0, with a revert level at $39.5. The alternative scenario (bearish) targets $35.0 and $28.0.
Multi-layer AI agents analyse 200+ stocks across daily, weekly, and monthly timeframes — producing market state classifications, price scenarios with targets, and position entry/exit levels. Updated every trading day after market close. No paywall. No sign-up required.
Built by Foliotrail.
All content on this website — including charts, analysis, price targets, support/resistance levels, and position zones — is generated entirely by AI and provided for educational and informational purposes only.
This is not financial advice. NEXUSNOIR VENTURES SL (the operator of this website) is not a registered investment adviser or broker-dealer. You should not make investment decisions based solely on this information. Always do your own research and consult a qualified financial advisor.
By continuing, you acknowledge that you have read and agree to our full disclaimer & terms of use and privacy policy.