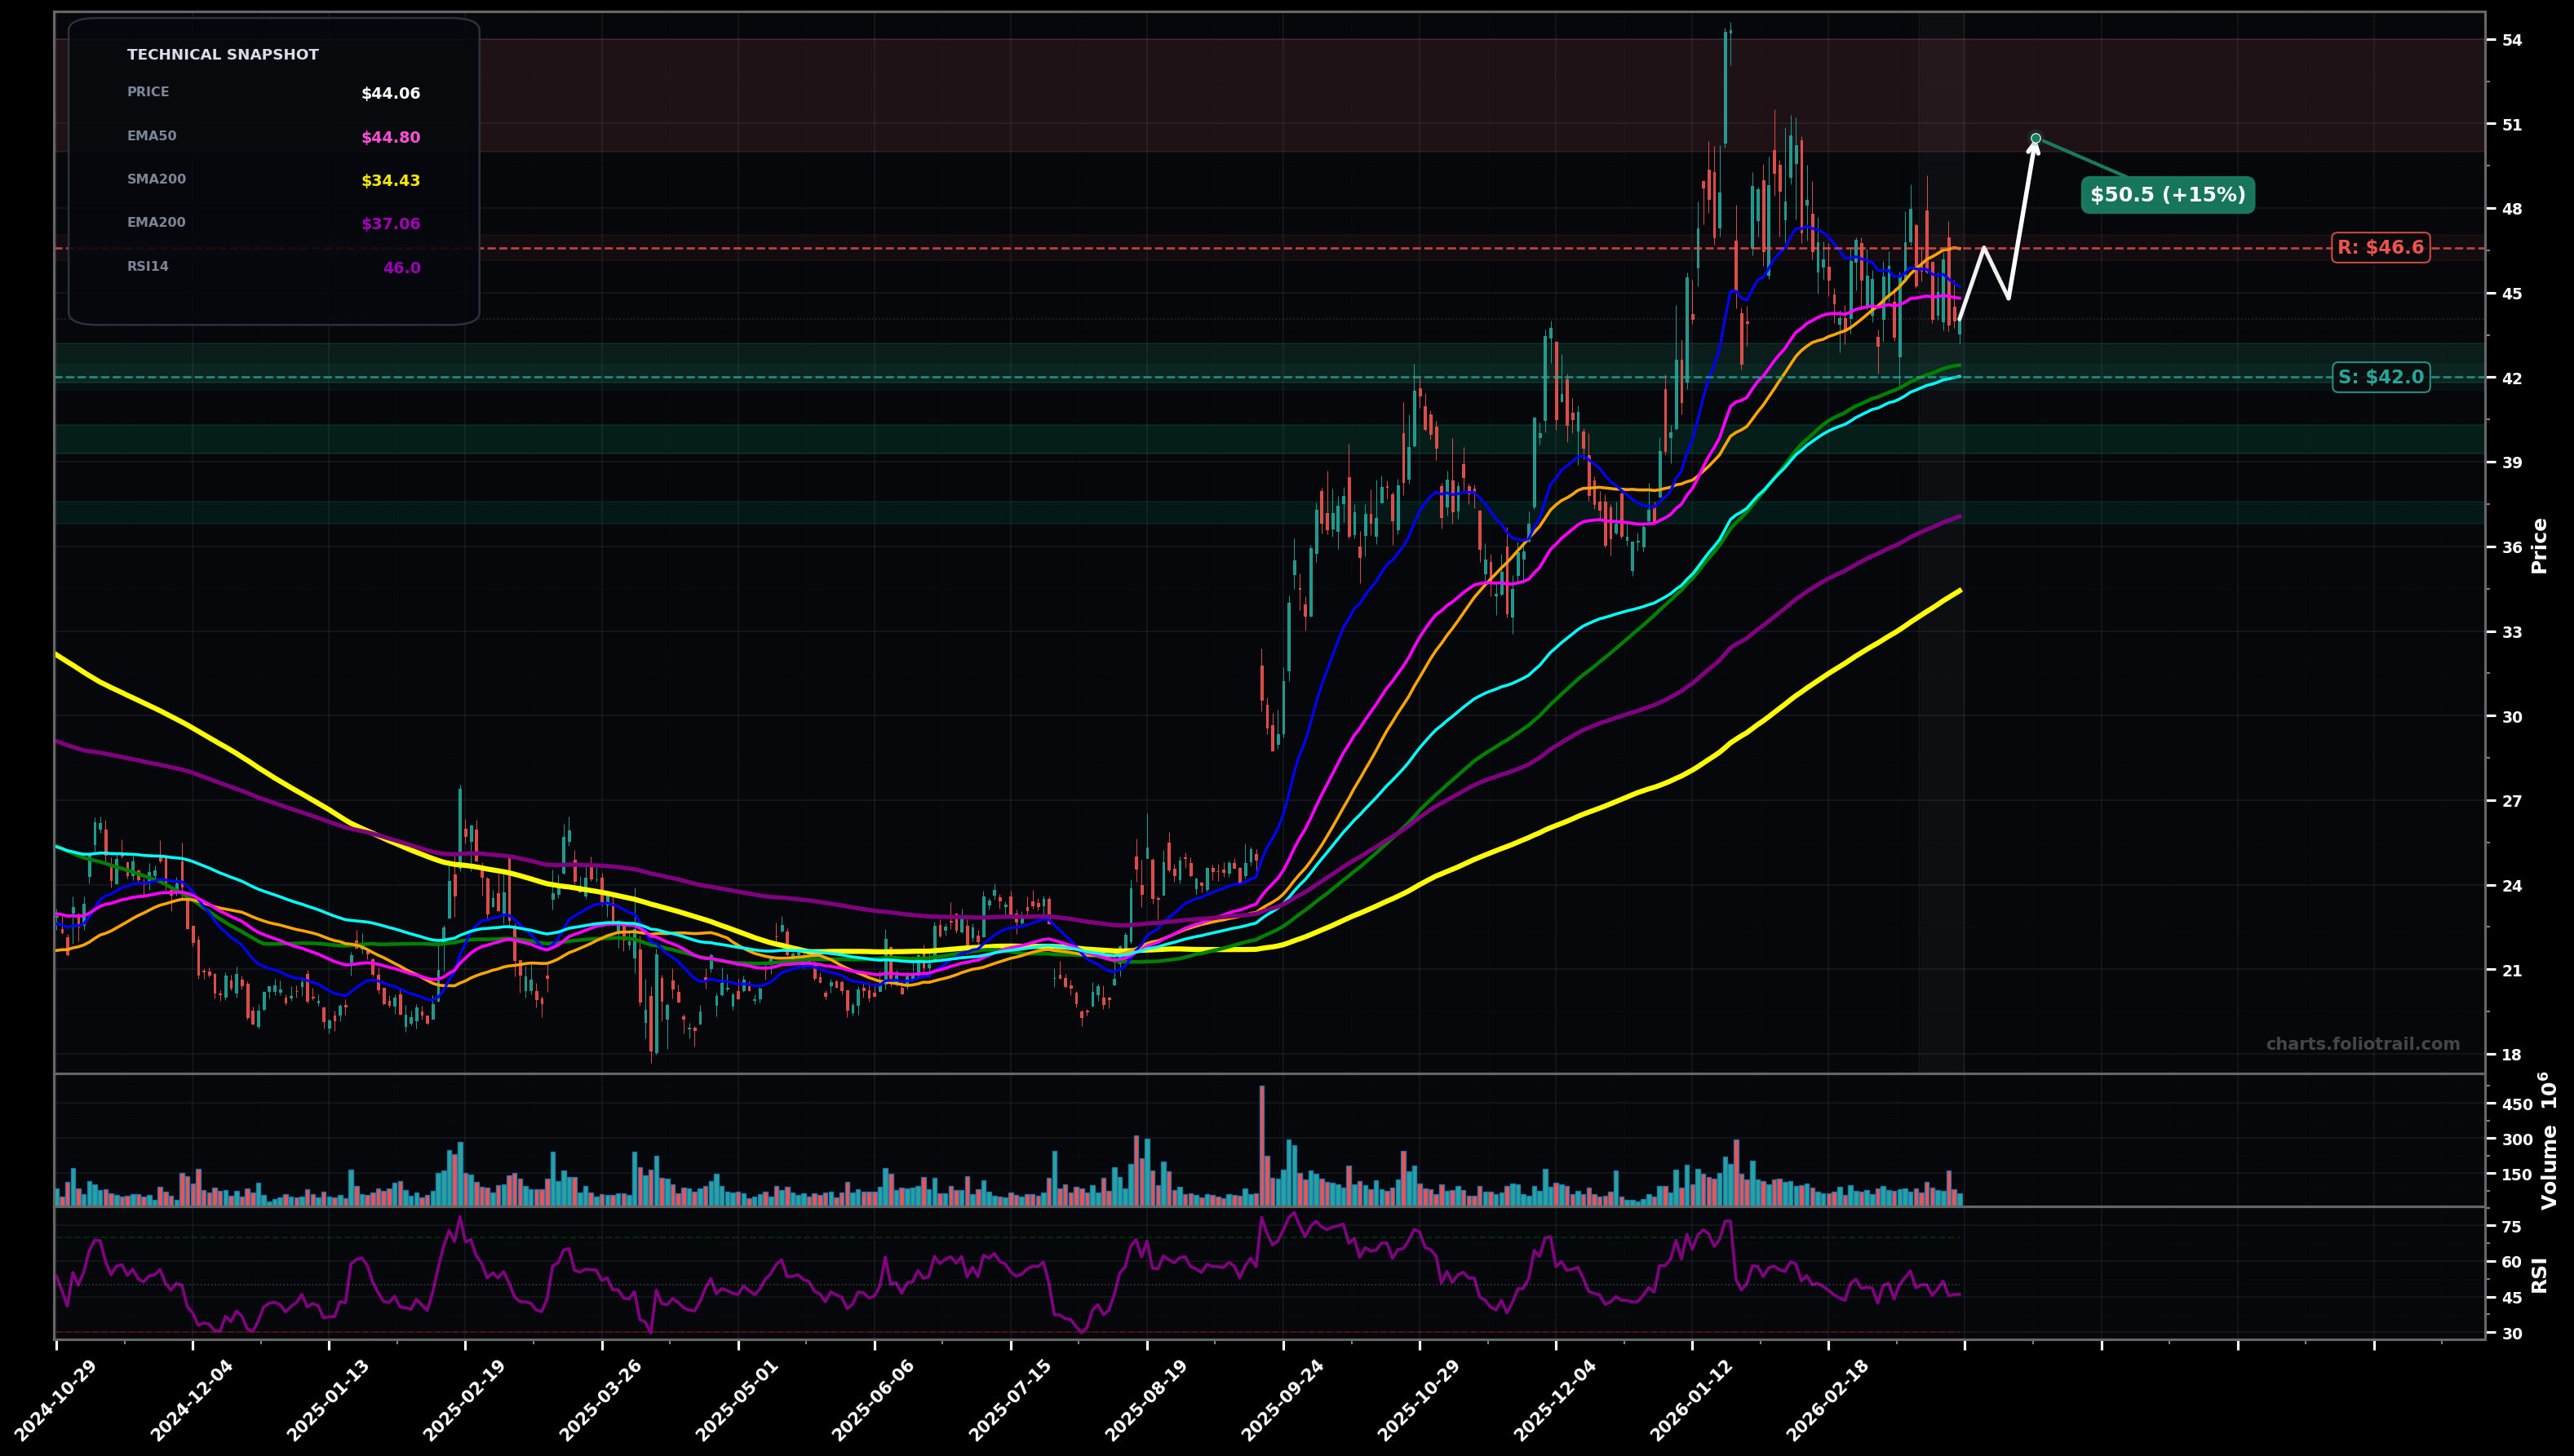
As of March 25, 2026, INTC (Intel Corporation) is in a choppy range state on the daily chart, with a confidence level of 63%. Key support is at $42.0 and key resistance at $46.6. Pullback from the ~$50-$54 spike into the $44 area; price is below the cluster of shorter MAs (SMA50/EMA20) and sitting near EMA50 while still above EMA100/SMA100; RSI ~46 (cooling momentum).
Range holds: price defends the $42-$44 demand/EMA100-EMA50 area, then pushes back to reclaim the short MAs; likely a Wave (4) consolidation before a potential Wave (5) attempt.
Breakdown: loss of the $42 support (EMA100/SMA100) triggers a deeper Fibonacci-style retrace of the prior impulse (from the ~$20 base to ~$54 peak), rotating toward the low-$40s then high-$30s.
2+ daily closes above $46.60 (SMA50 area) would confirm a breakout-reversal attempt back into the prior uptrend channel
Daily close below $42.00 (EMA100/SMA100 confluence) would invalidate the range-bias and shift toward a downtrend leg
Start near EMA100/SMA100 confluence; add on breakdown into the prior consolidation shelf (~$40); heavy add near EMA200 (~$37) where a larger Wave (4) / fib retrace often terminates.
Trim into prior blow-off supply ($50-$54); more trimming if a Wave (5) extension breaks to new highs; fully close if price becomes multi-year stretched far above the long MAs (EMA200/SMA200).
As of March 25, 2026, INTC (Intel Corporation) is in a choppy range state on the daily chart with 63% confidence. Pullback from the ~$50-$54 spike into the $44 area; price is below the cluster of shorter MAs (SMA50/EMA20) and sitting near EMA50 while still above EMA100/SMA100; RSI ~46 (cooling momentum).
On the daily timeframe, INTC has key support at $42.0 and key resistance at $46.6. The most likely scenario (bullish) targets $46.6 and $50.5, with a revert level at $44.8.
INTC (Intel Corporation) is currently classified as choppy range on the daily chart, with 63% confidence. Confirmation requires: 2+ daily closes above $46.60 (SMA50 area) would confirm a breakout-reversal attempt back into the prior uptrend channel This would be invalidated by: Daily close below $42.00 (EMA100/SMA100 confluence) would invalidate the range-bias and shift toward a downtrend leg
The most likely scenario (bullish) targets $46.6 and $50.5, with a revert level at $44.8. The alternative scenario (bearish) targets $39.8 and $37.1.
Multi-layer AI agents analyse 200+ stocks across daily, weekly, and monthly timeframes — producing market state classifications, price scenarios with targets, and position entry/exit levels. Updated every trading day after market close. No paywall. No sign-up required.
Built by Foliotrail.
All content on this website — including charts, analysis, price targets, support/resistance levels, and position zones — is generated entirely by AI and provided for educational and informational purposes only.
This is not financial advice. NEXUSNOIR VENTURES SL (the operator of this website) is not a registered investment adviser or broker-dealer. You should not make investment decisions based solely on this information. Always do your own research and consult a qualified financial advisor.
By continuing, you acknowledge that you have read and agree to our full disclaimer & terms of use and privacy policy.