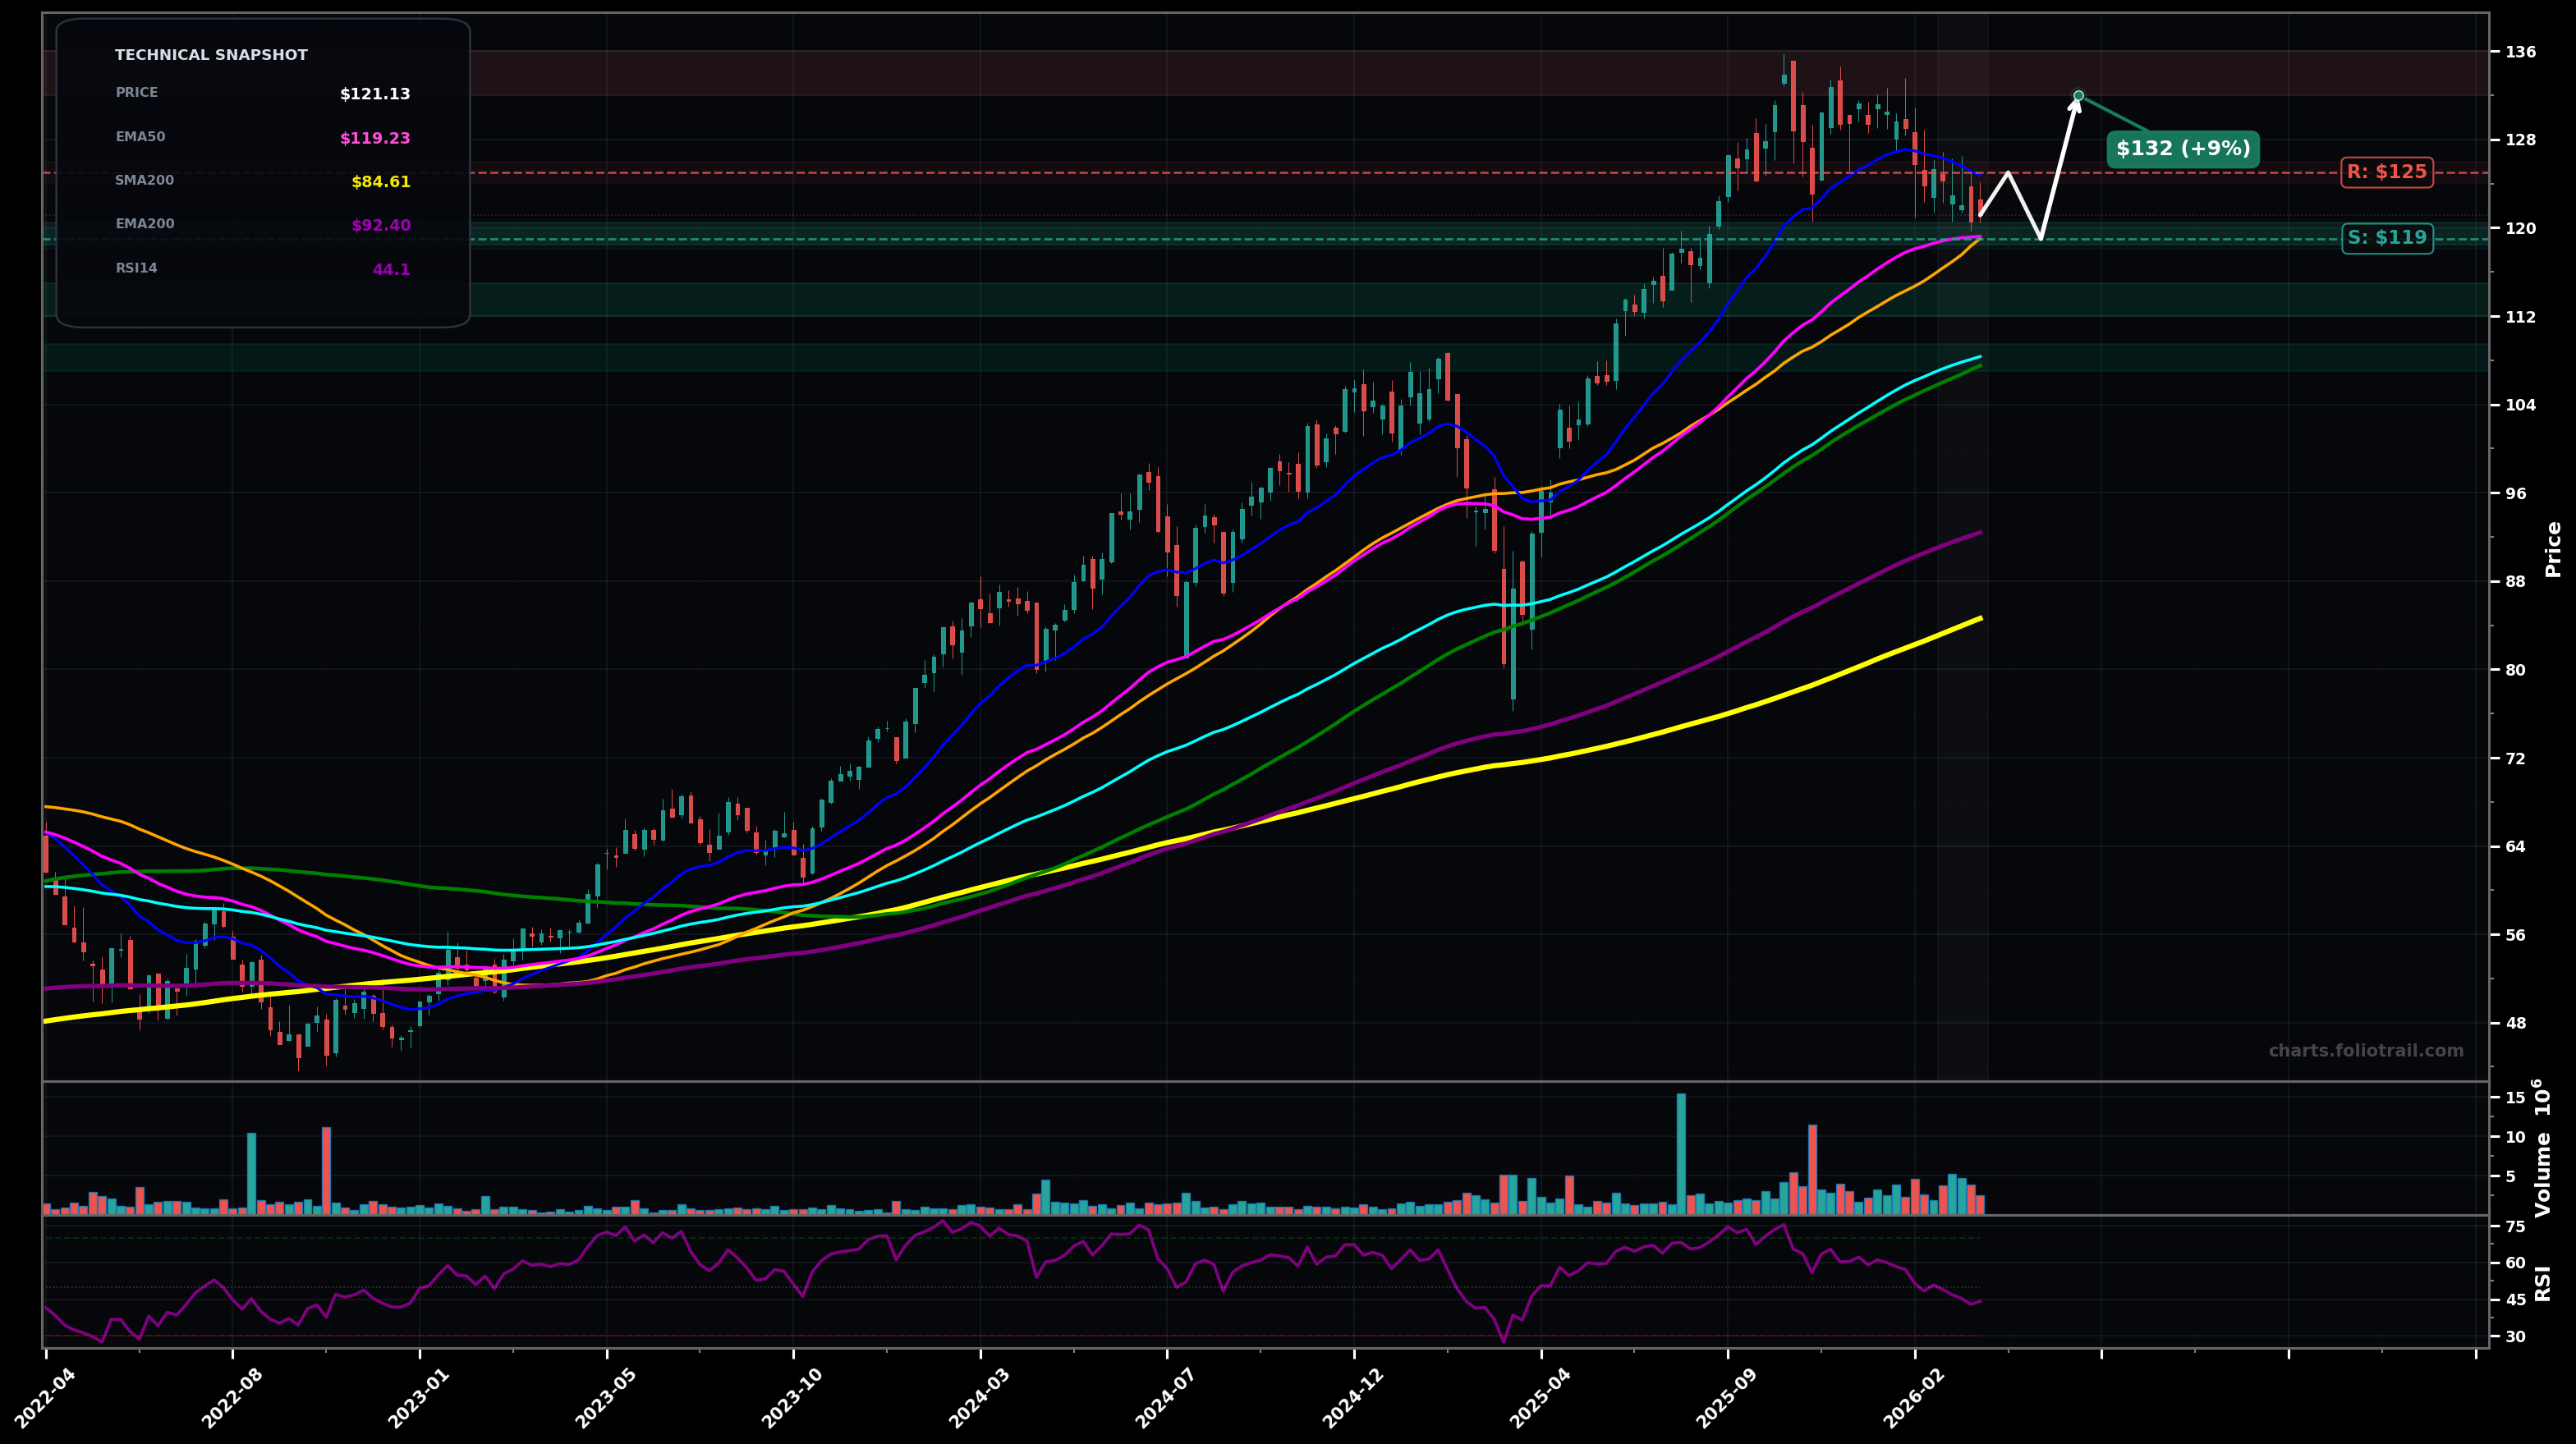
As of March 25, 2026, IGM (iShares Expanded Tech Sector ETF) is in a choppy range state on the weekly chart, with a confidence level of 58%. Key support is at $119 and key resistance at $125. Weekly pullback from the ~$135 peak; price (~$121.13) is sitting on the EMA50/SMA50 confluence (~$119) after a series of lower highs from the top; RSI(14) ~44 shows momentum cooling but not washed out.
Base/hold the $119 area (EMA50/SMA50) and rebound into a relief rally; likely a Wave 4-style correction resolving into a Wave 5 attempt, but with overhead supply near $125-$130 first.
Break $119 support and extend the correction into the rising medium-term averages; this would fit a deeper Wave 4 (or larger ABC) retrace toward the EMA100/SMA100 area before buyers re-engage.
2+ weekly closes holding above $125 (reclaim prior breakdown area) would confirm a breakout-reversal attempt from the pullback
A weekly close below $118 would invalidate the range/support thesis and shift bias to a deeper correction toward the $112-$108 band
Start at EMA50/SMA50 confluence (~$119); add at prior swing support/round-number shelf (~$112-115); heavy add near EMA100 (~$108) where a deeper Fibonacci-style retrace would likely complete.
Trim into prior ATH/supply ($132-136); trim more if price becomes extended above the recent peak and trend channel ($140-148); close if a multi-year overshoot/blow-off develops far above the MA stack ($155-170).
As of March 25, 2026, IGM (iShares Expanded Tech Sector ETF) is in a choppy range state on the weekly chart with 58% confidence. Weekly pullback from the ~$135 peak; price (~$121.13) is sitting on the EMA50/SMA50 confluence (~$119) after a series of lower highs from the top; RSI(14) ~44 shows momentum cooling but not washed out.
On the weekly timeframe, IGM has key support at $119 and key resistance at $125. The most likely scenario (bullish) targets $125 and $132, with a revert level at $119.
IGM (iShares Expanded Tech Sector ETF) is currently classified as choppy range on the weekly chart, with 58% confidence. Confirmation requires: 2+ weekly closes holding above $125 (reclaim prior breakdown area) would confirm a breakout-reversal attempt from the pullback This would be invalidated by: A weekly close below $118 would invalidate the range/support thesis and shift bias to a deeper correction toward the $112-$108 band
The most likely scenario (bullish) targets $125 and $132, with a revert level at $119. The alternative scenario (bearish) targets $112 and $108.
Multi-layer AI agents analyse 200+ stocks across daily, weekly, and monthly timeframes — producing market state classifications, price scenarios with targets, and position entry/exit levels. Updated every trading day after market close. No paywall. No sign-up required.
Built by Foliotrail.
All content on this website — including charts, analysis, price targets, support/resistance levels, and position zones — is generated entirely by AI and provided for educational and informational purposes only.
This is not financial advice. NEXUSNOIR VENTURES SL (the operator of this website) is not a registered investment adviser or broker-dealer. You should not make investment decisions based solely on this information. Always do your own research and consult a qualified financial advisor.
By continuing, you acknowledge that you have read and agree to our full disclaimer & terms of use and privacy policy.