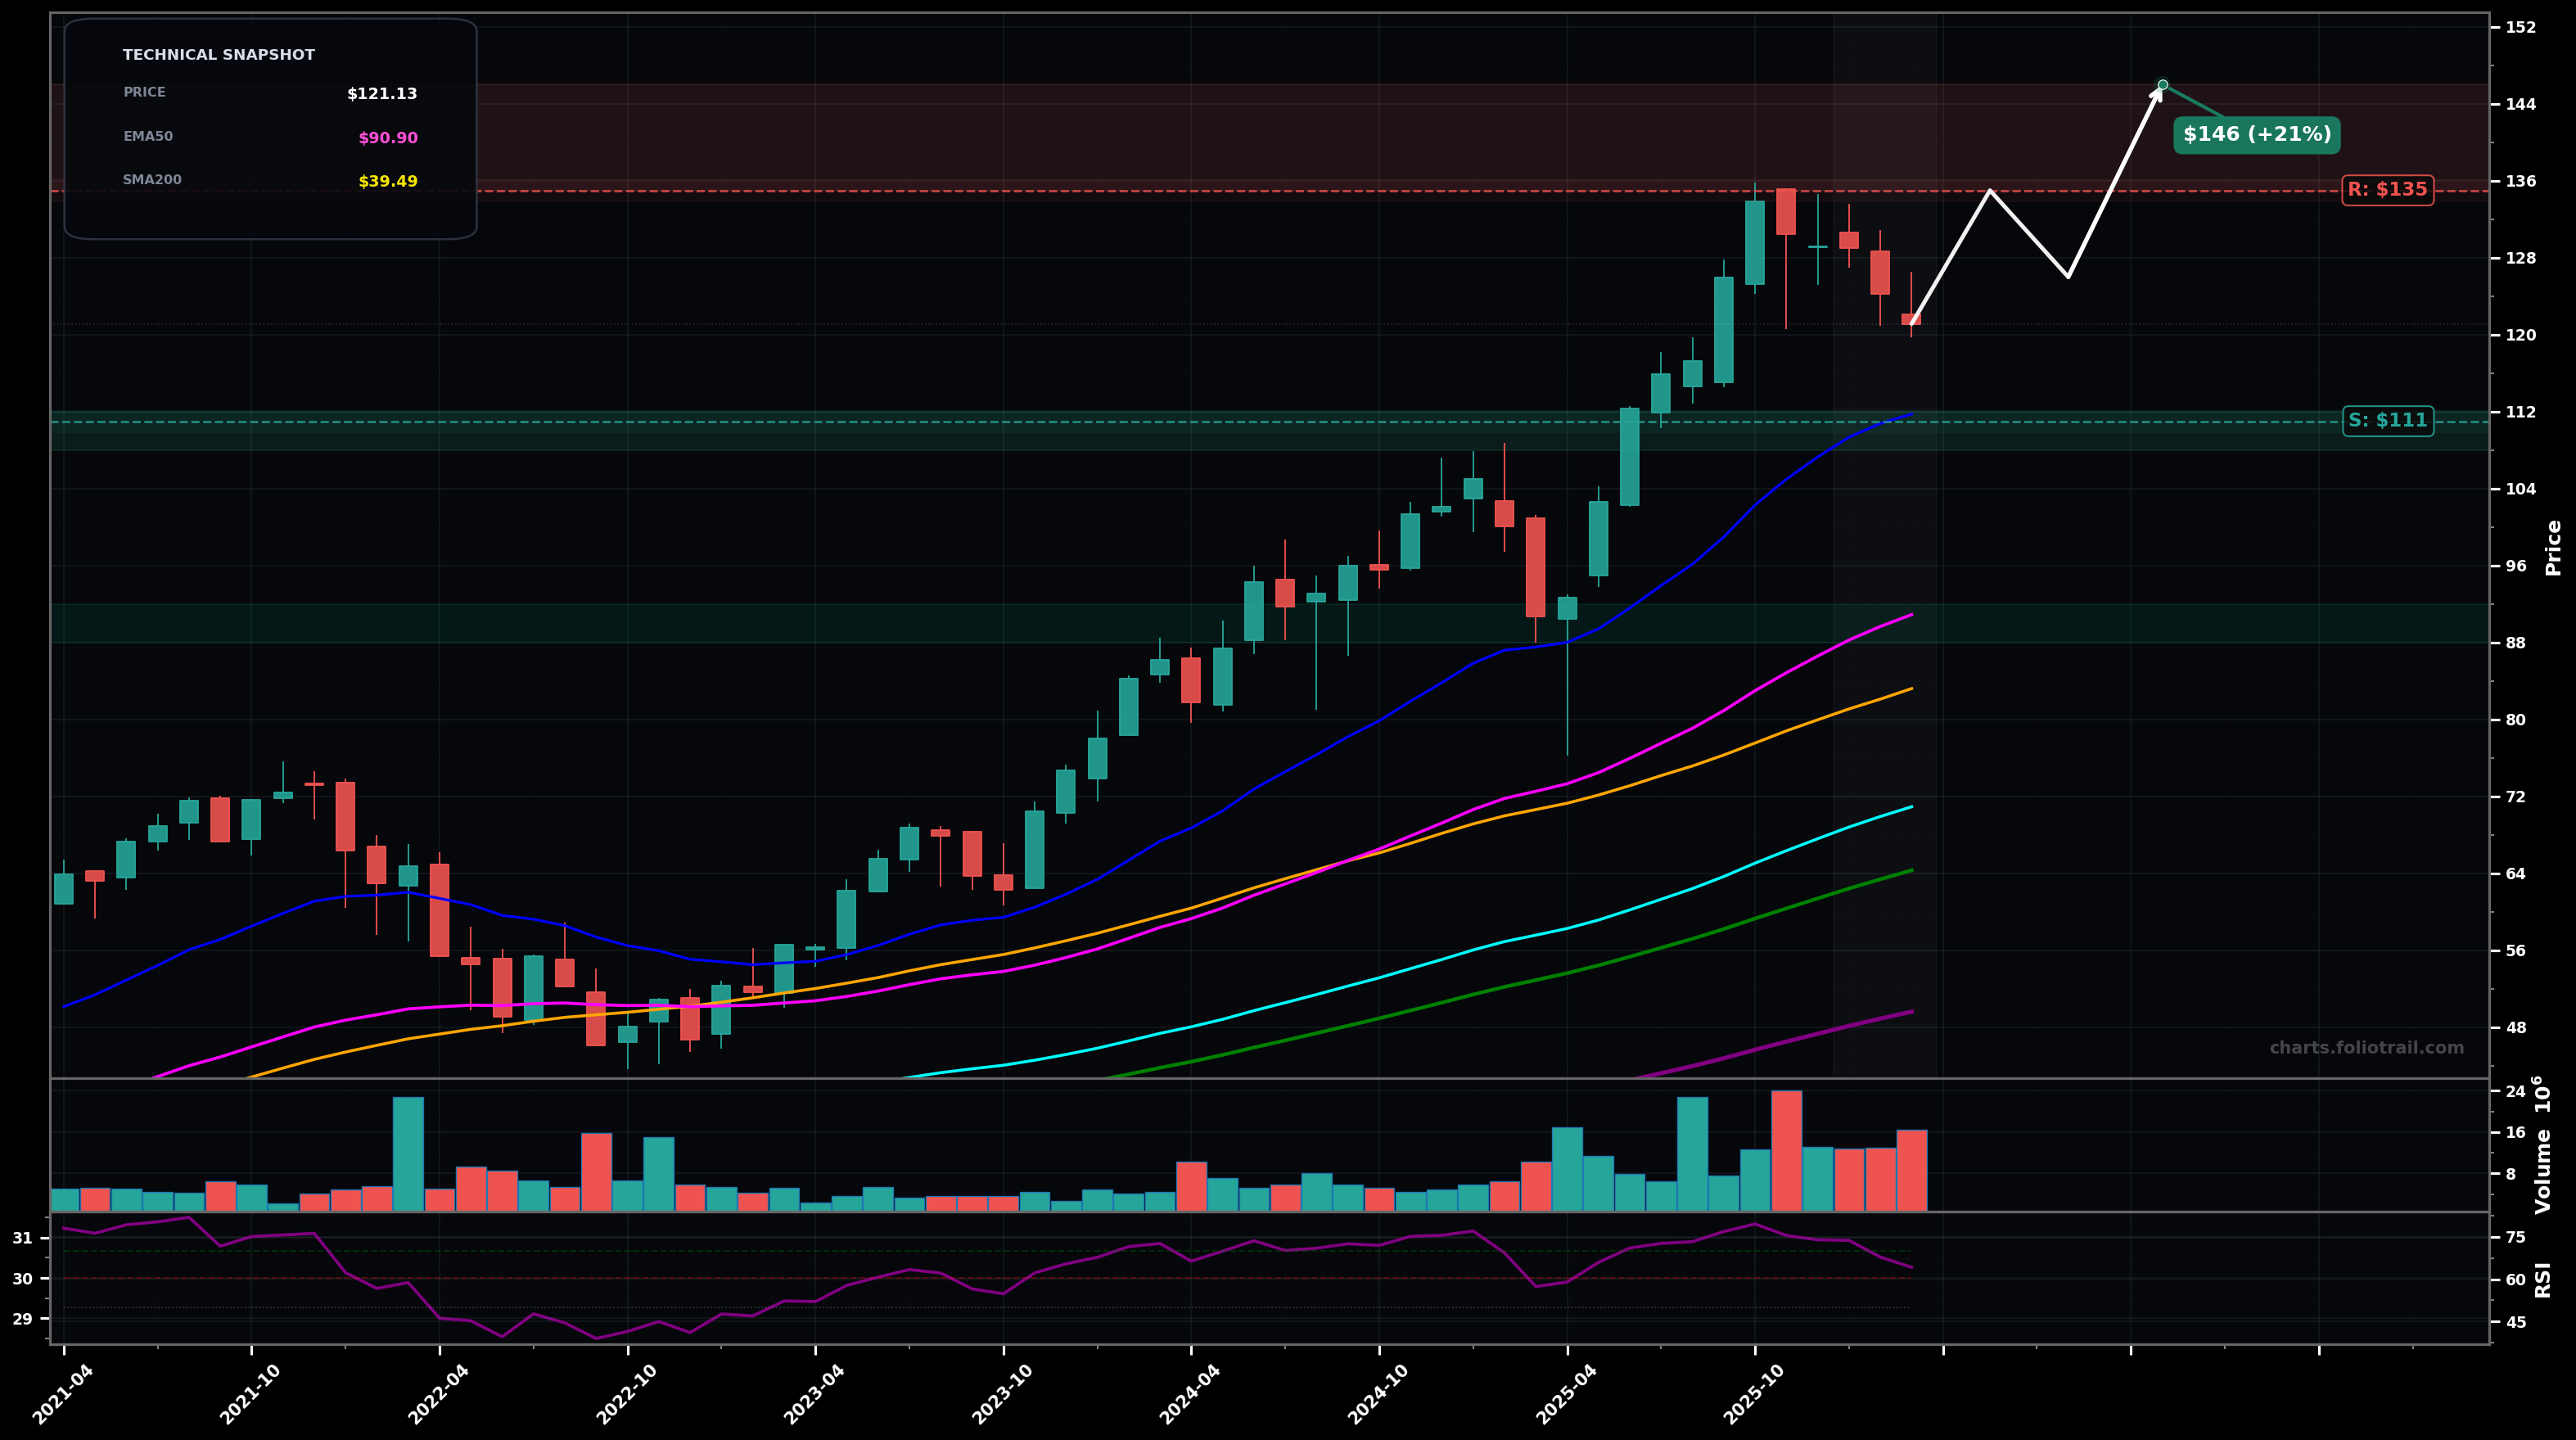
As of March 25, 2026, IGM (iShares Expanded Tech Sector ETF) is in a uptrend state on the monthly chart, with a confidence level of 72%. Key support is at $111 and key resistance at $135. Monthly uptrend pulled back from the ~$135 swing high into ~$121 with 3 consecutive red candles; price still well above EMA50/EMA100 with RSI ~64 (cooling from near-overbought).
Bullish continuation after a normal Wave-4 style pullback: price stabilizes above ~$111, then grinds back to retest ~$135; if cleared, extends toward Fib projections into the mid-$140s.
Deeper correction (larger ABC/Wave-4): support at ~$111 breaks, price mean-reverts toward the rising EMA20/previous breakout zone, then attempts a bounce but faces supply at prior support.
Monthly close back above $126 followed by a breakout over $135.
Monthly close below $111 (loss of the current swing-low reference area).
Start near swing-low support (~$111) for trend-continuation; add on a controlled break to the next demand shelf (~$104); heavy add only on a full mean-reversion into EMA50/SMA50 cluster (~$90).
Trim into prior ATH/swing-high supply (~$135) and Fib-extension zone (~$146); increase trimming if price gets increasingly stretched vs EMA50/SMA50; close if an outsized blow-off extension develops into ~$160+.
As of March 25, 2026, IGM (iShares Expanded Tech Sector ETF) is in a uptrend state on the monthly chart with 72% confidence. Monthly uptrend pulled back from the ~$135 swing high into ~$121 with 3 consecutive red candles; price still well above EMA50/EMA100 with RSI ~64 (cooling from near-overbought).
On the monthly timeframe, IGM has key support at $111 and key resistance at $135. The most likely scenario (bullish) targets $135 and $146, with a revert level at $126.
IGM (iShares Expanded Tech Sector ETF) is currently classified as uptrend on the monthly chart, with 72% confidence. Confirmation requires: Monthly close back above $126 followed by a breakout over $135. This would be invalidated by: Monthly close below $111 (loss of the current swing-low reference area).
The most likely scenario (bullish) targets $135 and $146, with a revert level at $126. The alternative scenario (bearish) targets $104 and $91.0.
Multi-layer AI agents analyse 200+ stocks across daily, weekly, and monthly timeframes — producing market state classifications, price scenarios with targets, and position entry/exit levels. Updated every trading day after market close. No paywall. No sign-up required.
Built by Foliotrail.
All content on this website — including charts, analysis, price targets, support/resistance levels, and position zones — is generated entirely by AI and provided for educational and informational purposes only.
This is not financial advice. NEXUSNOIR VENTURES SL (the operator of this website) is not a registered investment adviser or broker-dealer. You should not make investment decisions based solely on this information. Always do your own research and consult a qualified financial advisor.
By continuing, you acknowledge that you have read and agree to our full disclaimer & terms of use and privacy policy.