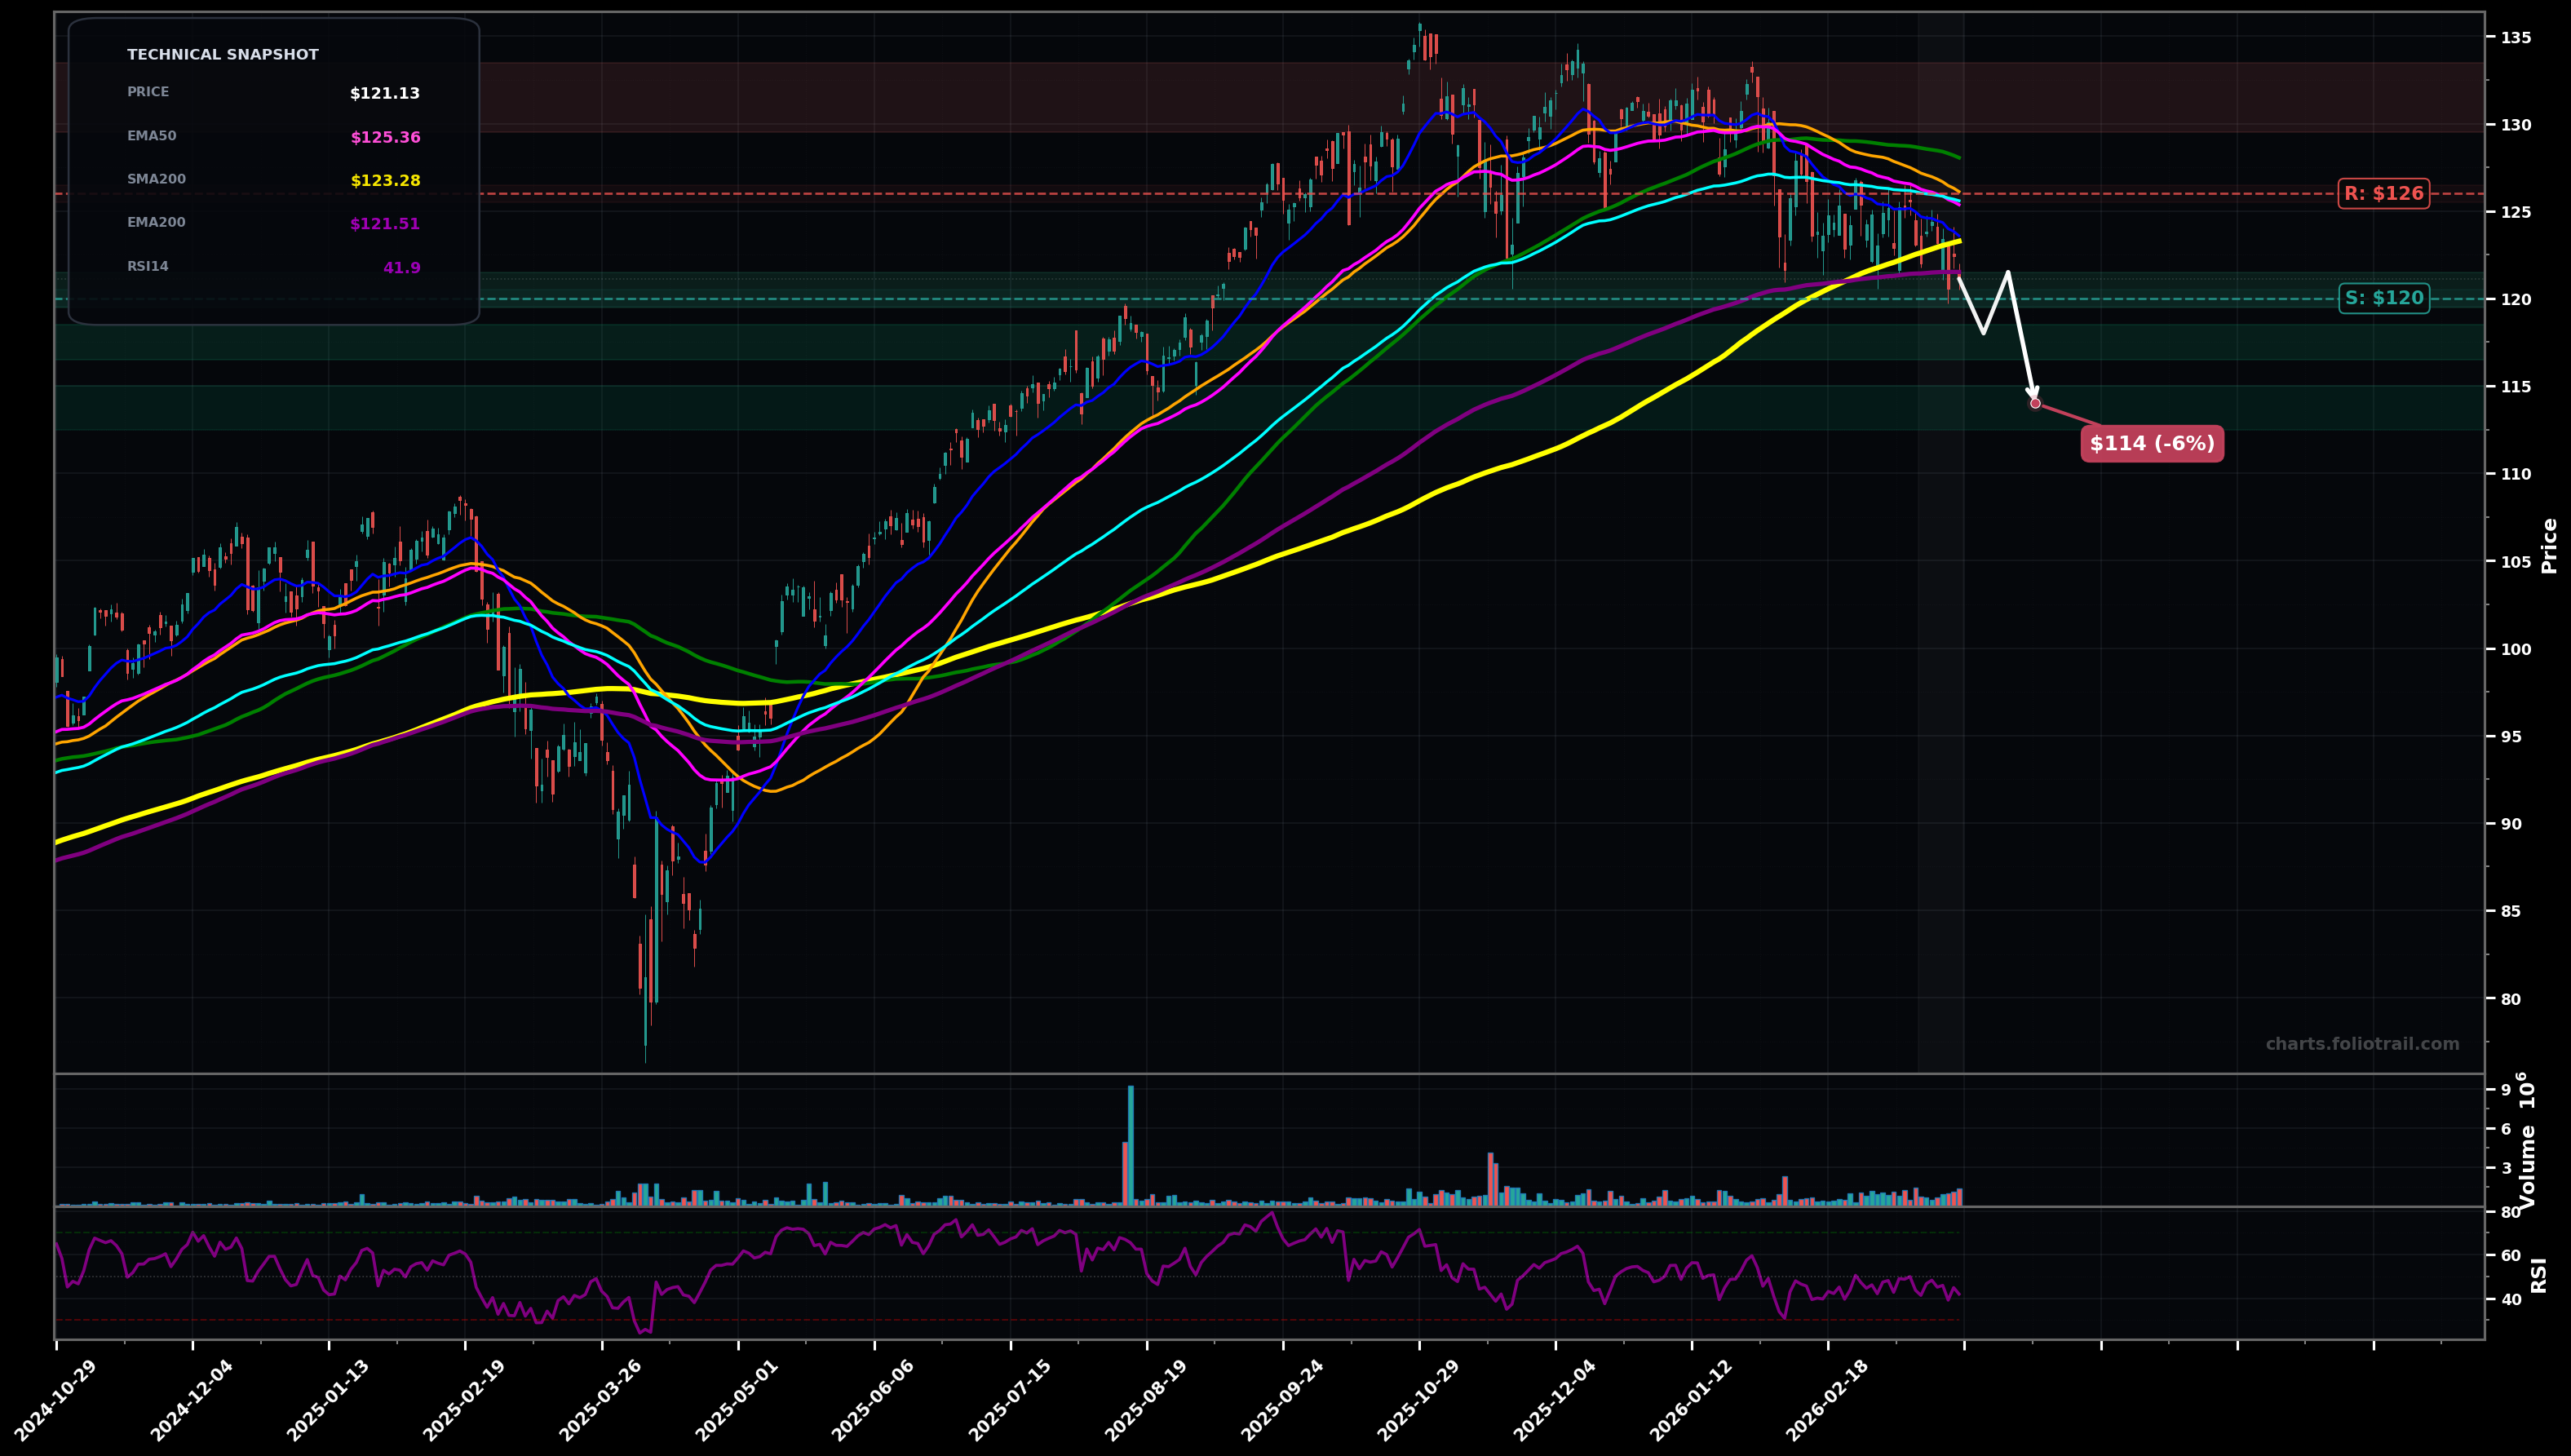
As of March 25, 2026, IGM (iShares Expanded Tech Sector ETF) is in a choppy range state on the daily chart, with a confidence level of 62%. Key support is at $120 and key resistance at $126. Price $121.13 is drifting lower into the clustered long MAs; trading below EMA50/EMA100 and under SMA50/SMA100 while hovering around the $121-$123 zone (EMA200/SMA200). RSI14 ~42 shows weak momentum but not capitulation.
Range resolves bearish: lose the $120 support/EMA200 area, triggering a deeper pullback toward the next demand zone, consistent with a larger Elliott Wave ABC (C leg) off the $135 peak; expect a possible dead-cat bounce back to the broken $120-$123 area before continuation.
Bullish reversal attempt: reclaim $126 (MA band) and hold for 2+ daily closes, suggesting the correction is ending (ABC complete) and a new impulsive leg starts; price then works back toward the prior distribution area near $130-$132.
CHOPPY_RANGE confirmed if price continues to hold between $120 and $126 with 2+ closes failing to break out.
Invalid if a daily close below $119.80 (clean break under the $120 pivot/MA cluster) or a daily close above $126.20 (reclaim and hold above the near-term MA band).
Start near the EMA200/SMA200 confluence (~$121-$123) and key pivot ~$120; add on breakdown/retest into prior swing-demand; heavy add near the next major support shelf where a full ABC retrace would likely complete.
Trim into the $130-$135 overhead supply (prior range top / prior swing-high zone); heavier trimming if price revisits/extends above the prior $135 peak; close if a euphoric extension pushes well beyond prior highs.
As of March 25, 2026, IGM (iShares Expanded Tech Sector ETF) is in a choppy range state on the daily chart with 62% confidence. Price $121.13 is drifting lower into the clustered long MAs; trading below EMA50/EMA100 and under SMA50/SMA100 while hovering around the $121-$123 zone (EMA200/SMA200). RSI14 ~42 shows weak momentum but not capitulation.
On the daily timeframe, IGM has key support at $120 and key resistance at $126. The most likely scenario (bearish) targets $118 and $114, with a revert level at $122.
IGM (iShares Expanded Tech Sector ETF) is currently classified as choppy range on the daily chart, with 62% confidence. Confirmation requires: CHOPPY_RANGE confirmed if price continues to hold between $120 and $126 with 2+ closes failing to break out. This would be invalidated by: Invalid if a daily close below $119.80 (clean break under the $120 pivot/MA cluster) or a daily close above $126.20 (reclaim and hold above the near-term MA band).
The most likely scenario (bearish) targets $118 and $114, with a revert level at $122. The alternative scenario (bullish) targets $130 and $134.
Multi-layer AI agents analyse 200+ stocks across daily, weekly, and monthly timeframes — producing market state classifications, price scenarios with targets, and position entry/exit levels. Updated every trading day after market close. No paywall. No sign-up required.
Built by Foliotrail.
All content on this website — including charts, analysis, price targets, support/resistance levels, and position zones — is generated entirely by AI and provided for educational and informational purposes only.
This is not financial advice. NEXUSNOIR VENTURES SL (the operator of this website) is not a registered investment adviser or broker-dealer. You should not make investment decisions based solely on this information. Always do your own research and consult a qualified financial advisor.
By continuing, you acknowledge that you have read and agree to our full disclaimer & terms of use and privacy policy.