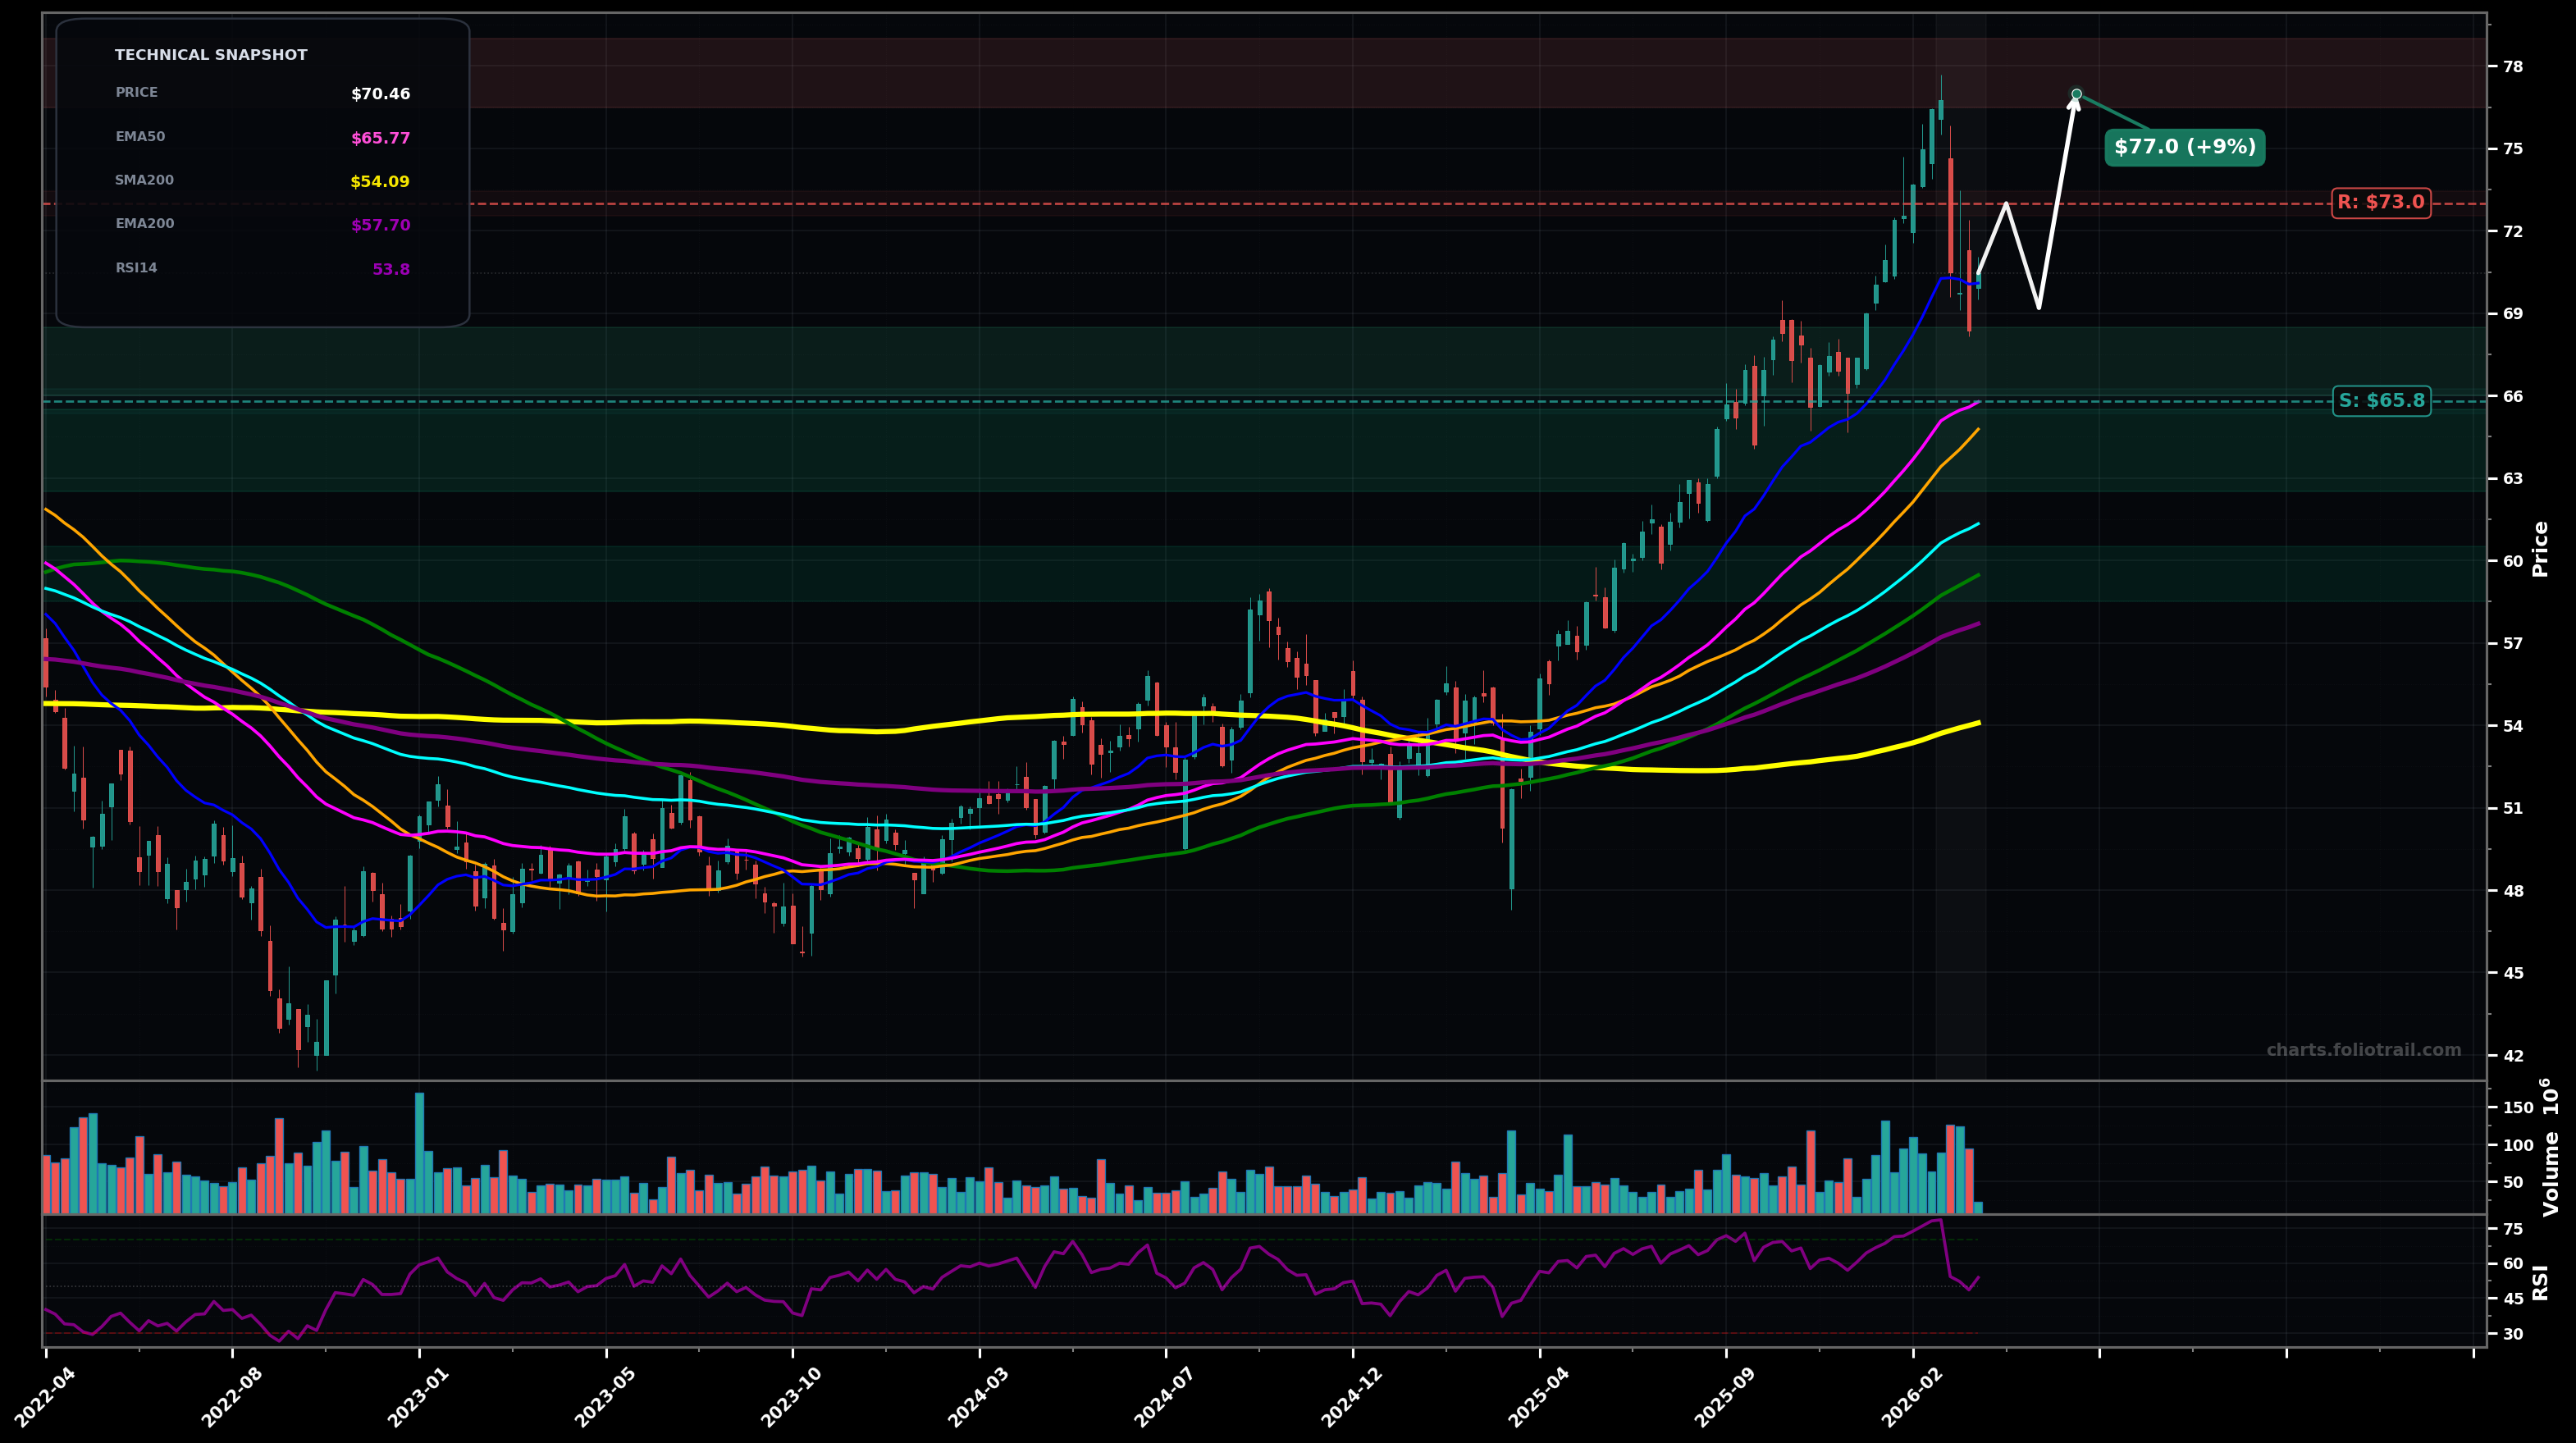
As of March 24, 2026, IEMG (iShares Core MSCI Emerging Markets ETF) is in a uptrend state on the weekly chart, with a confidence level of 66%. Key support is at $65.8 and key resistance at $73.0. After a strong HH/HL advance into ~$77, price pulled back to ~$70.46, sitting just below the fast EMA cluster (EMA20/EMA50) while still well above EMA100/EMA200 and all key SMAs; RSI cooled to ~54.
Bullish continuation: the current pullback holds above the EMA50 / prior breakout area, then resumes the primary uptrend (likely Wave 4 completing with Wave 5 attempt).
Deeper correction: failed reclaim of the fast EMAs leads to a larger ABC pullback toward the EMA100 / prior consolidation (fib-type retrace of the impulse leg).
Weekly close back above $71.50 with follow-through (next week holding above $71.50).
Weekly close below $65.75 (loss of EMA50 and prior breakout shelf).
Start near EMA50/structure support; add near EMA100 + prior range; heavy add near SMA100 (~$59.5) where a larger Wave-4/ABC could terminate if trend remains intact.
Trim into retests/overextensions above the prior swing high (~$77) and potential fib extensions; progressively reduce if price becomes stretched far above EMA50/EMA100 for a multi-year mean-reversion risk.
As of March 24, 2026, IEMG (iShares Core MSCI Emerging Markets ETF) is in a uptrend state on the weekly chart with 66% confidence. After a strong HH/HL advance into ~$77, price pulled back to ~$70.46, sitting just below the fast EMA cluster (EMA20/EMA50) while still well above EMA100/EMA200 and all key SMAs; RSI cooled to ~54.
On the weekly timeframe, IEMG has key support at $65.8 and key resistance at $73.0. The most likely scenario (bullish) targets $73.0 and $77.0, with a revert level at $69.2.
IEMG (iShares Core MSCI Emerging Markets ETF) is currently classified as uptrend on the weekly chart, with 66% confidence. Confirmation requires: Weekly close back above $71.50 with follow-through (next week holding above $71.50). This would be invalidated by: Weekly close below $65.75 (loss of EMA50 and prior breakout shelf).
The most likely scenario (bullish) targets $73.0 and $77.0, with a revert level at $69.2. The alternative scenario (bearish) targets $63.0 and $59.5.
All content on this website — including charts, analysis, price targets, support/resistance levels, and position zones — is generated entirely by AI and provided for educational and informational purposes only.
This is not financial advice. NEXUSNOIR VENTURES SL (the operator of this website) is not a registered investment adviser or broker-dealer. You should not make investment decisions based solely on this information. Always do your own research and consult a qualified financial advisor.
By continuing, you acknowledge that you have read and agree to our full disclaimer & terms of use and privacy policy.