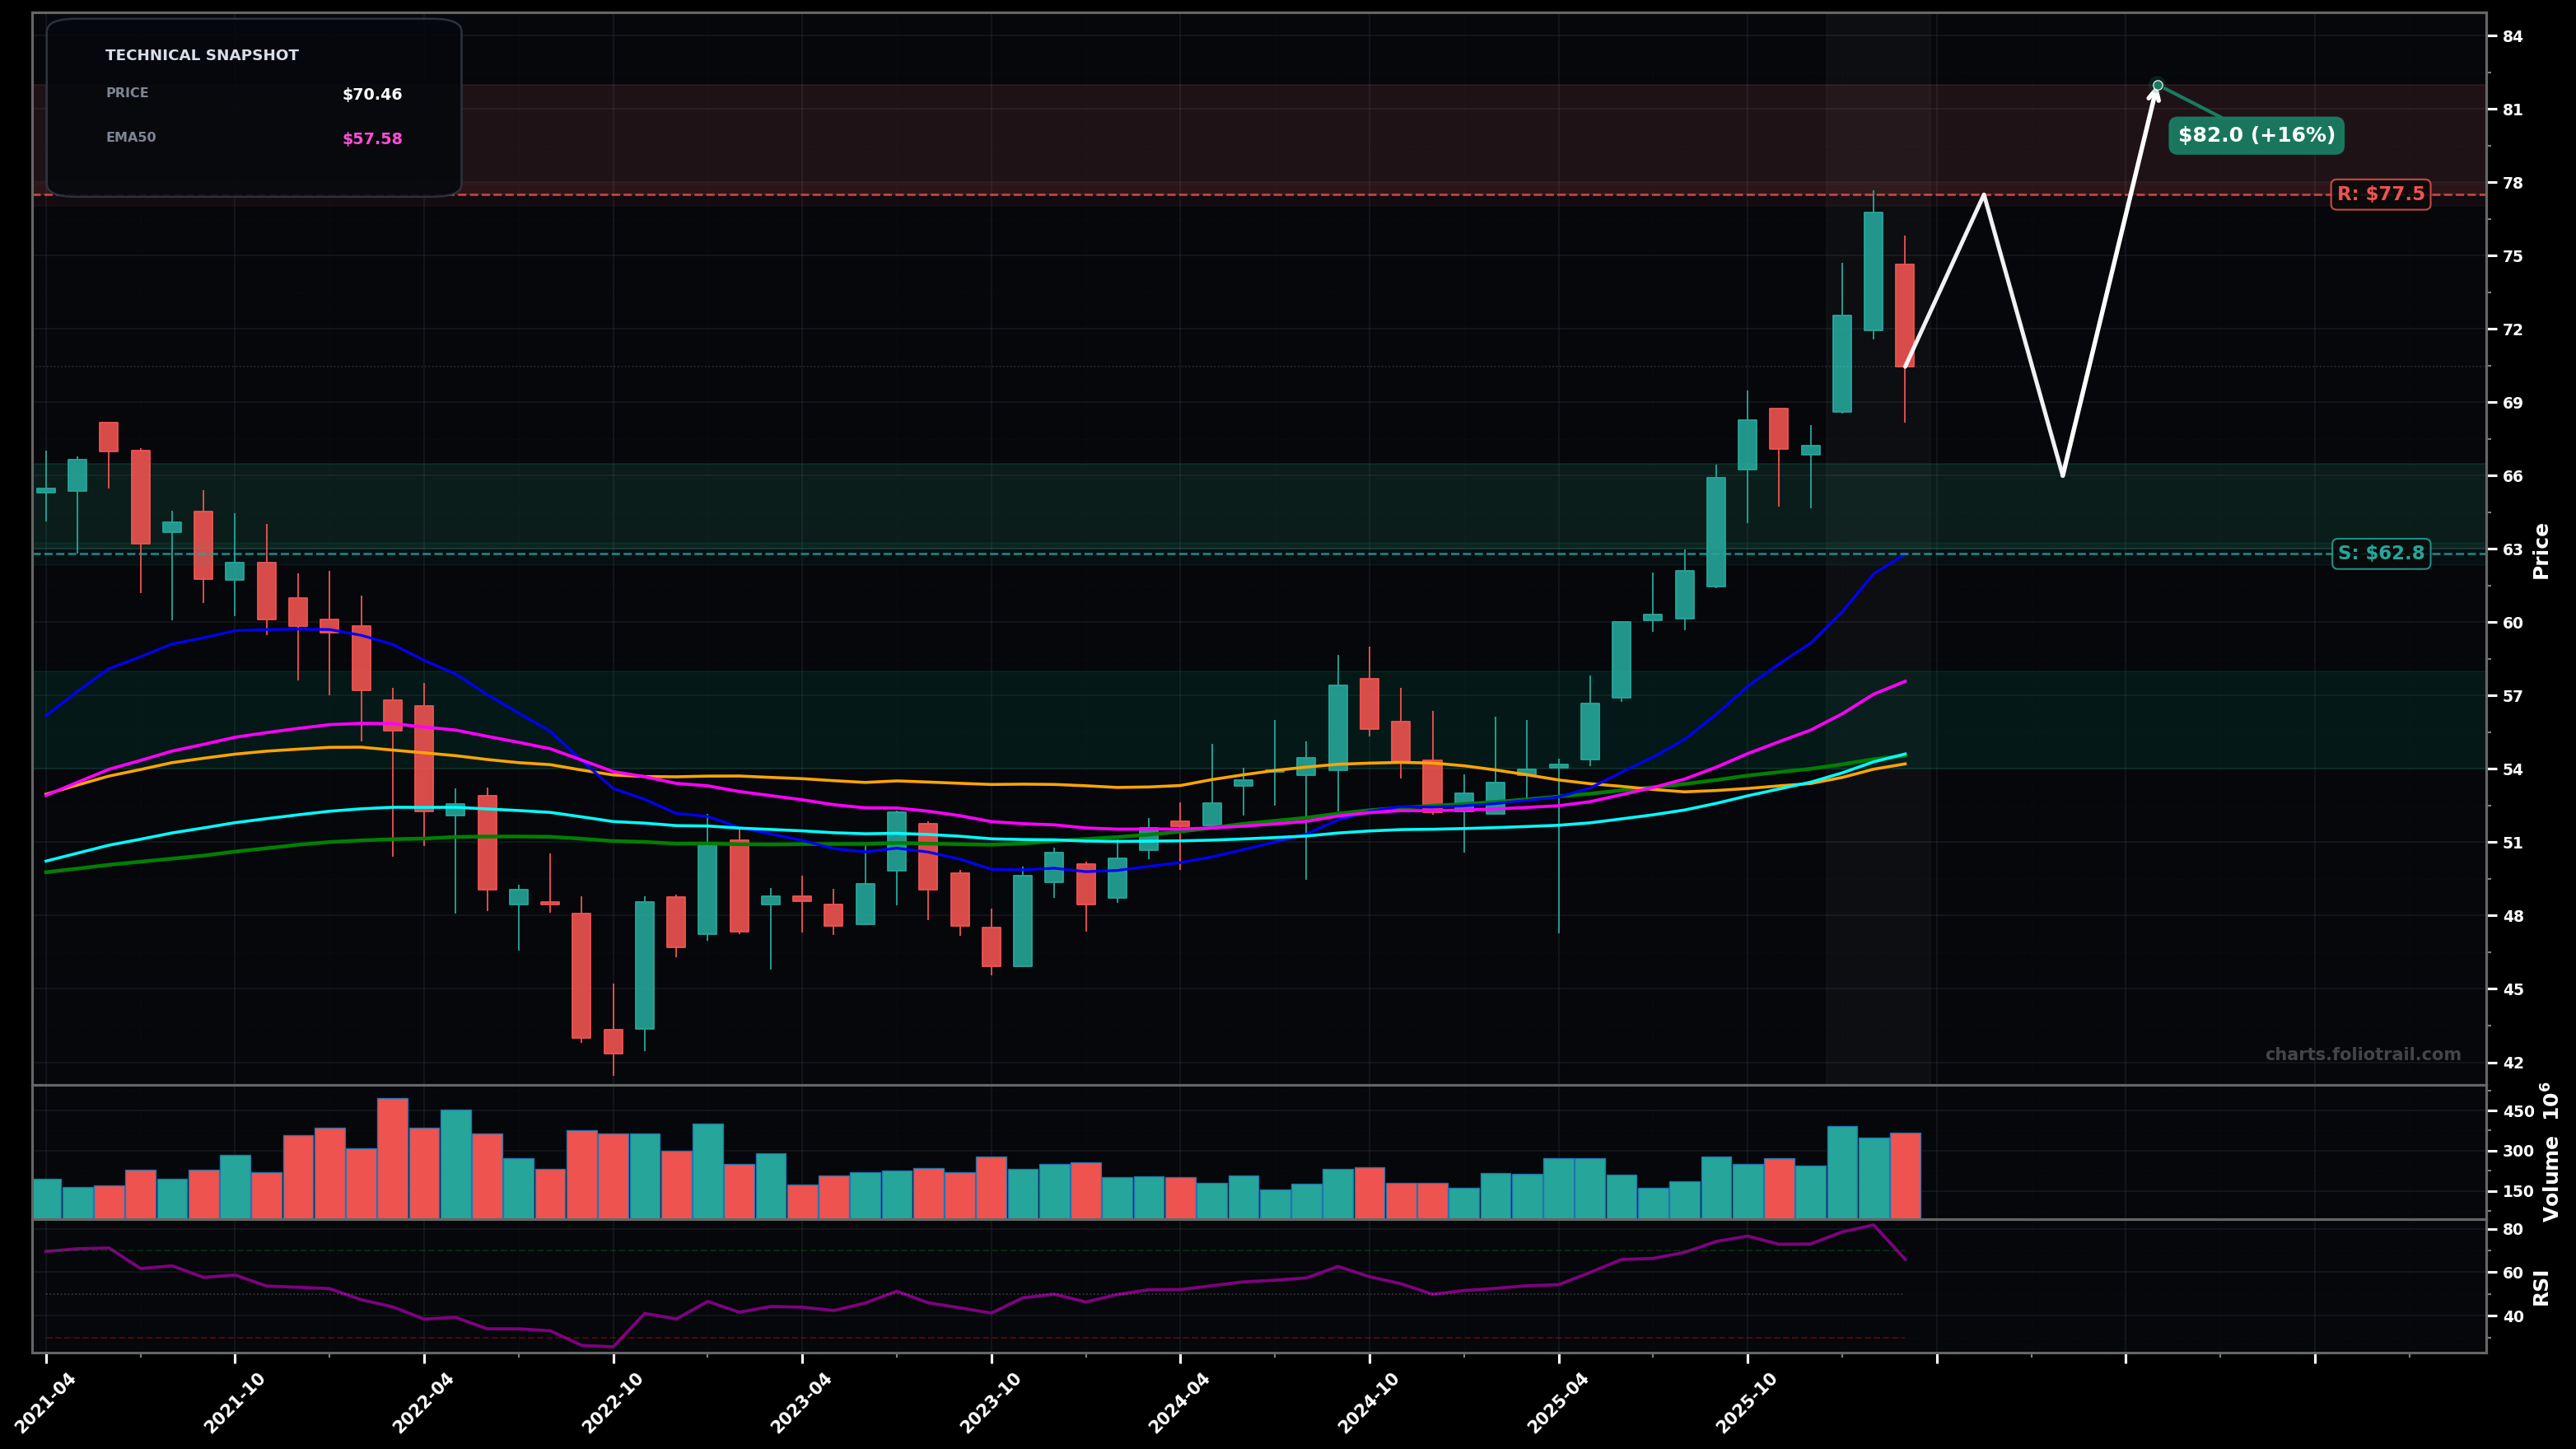
As of March 24, 2026, IEMG (iShares Core MSCI Emerging Markets ETF) is in a uptrend state on the monthly chart, with a confidence level of 72%. Key support is at $62.8 and key resistance at $77.5. Strong multi-month rally into a spike high near ~$77 followed by a pullback to ~$70.46; price still well above rising EMA50/EMA100 with RSI cooling (~66).
Bullish continuation after a controlled pullback: price holds the $62.8-$66 area, consolidates, then attempts a retest and break of the ~$77.5 high (Elliott: likely late wave 3 / early wave 5 behavior after a strong impulse; Fibonacci extension targets above the prior swing). Rough probability: 60%.
Deeper monthly mean-reversion: failure to regain ~$75 leads to a larger ABC-style correction toward the rising EMA50 and the prior breakout zone (Elliott: wave 4-type pullback), before any new highs. Rough probability: 40%.
Monthly close above $75.00 (reclaiming the recent pullback zone) would confirm trend continuation.
Monthly close below $62.80 (approx EMA20 / prior breakout shelf) would invalidate the clean uptrend structure and raise deeper pullback risk.
Start near the first major breakout retest/EMA20 shelf (~$63-66); add on deeper pullback toward EMA50 (~$58) and heavy add into the confluence of long MAs clustered ~$54-55 (SMA50/100/EMA100 area).
Trim into prior high + extension zone ($77.5-$82); trim more on further extension ($82-$88); close into a more stretched multi-year extension band ($88-$95) where risk/reward typically deteriorates versus the clustered long MAs far below.
As of March 24, 2026, IEMG (iShares Core MSCI Emerging Markets ETF) is in a uptrend state on the monthly chart with 72% confidence. Strong multi-month rally into a spike high near ~$77 followed by a pullback to ~$70.46; price still well above rising EMA50/EMA100 with RSI cooling (~66).
On the monthly timeframe, IEMG has key support at $62.8 and key resistance at $77.5. The most likely scenario (bullish) targets $77.5 and $82.0, with a revert level at $66.0.
IEMG (iShares Core MSCI Emerging Markets ETF) is currently classified as uptrend on the monthly chart, with 72% confidence. Confirmation requires: Monthly close above $75.00 (reclaiming the recent pullback zone) would confirm trend continuation. This would be invalidated by: Monthly close below $62.80 (approx EMA20 / prior breakout shelf) would invalidate the clean uptrend structure and raise deeper pullback risk.
The most likely scenario (bullish) targets $77.5 and $82.0, with a revert level at $66.0. The alternative scenario (bearish) targets $62.8 and $57.6.
All content on this website — including charts, analysis, price targets, support/resistance levels, and position zones — is generated entirely by AI and provided for educational and informational purposes only.
This is not financial advice. NEXUSNOIR VENTURES SL (the operator of this website) is not a registered investment adviser or broker-dealer. You should not make investment decisions based solely on this information. Always do your own research and consult a qualified financial advisor.
By continuing, you acknowledge that you have read and agree to our full disclaimer & terms of use and privacy policy.