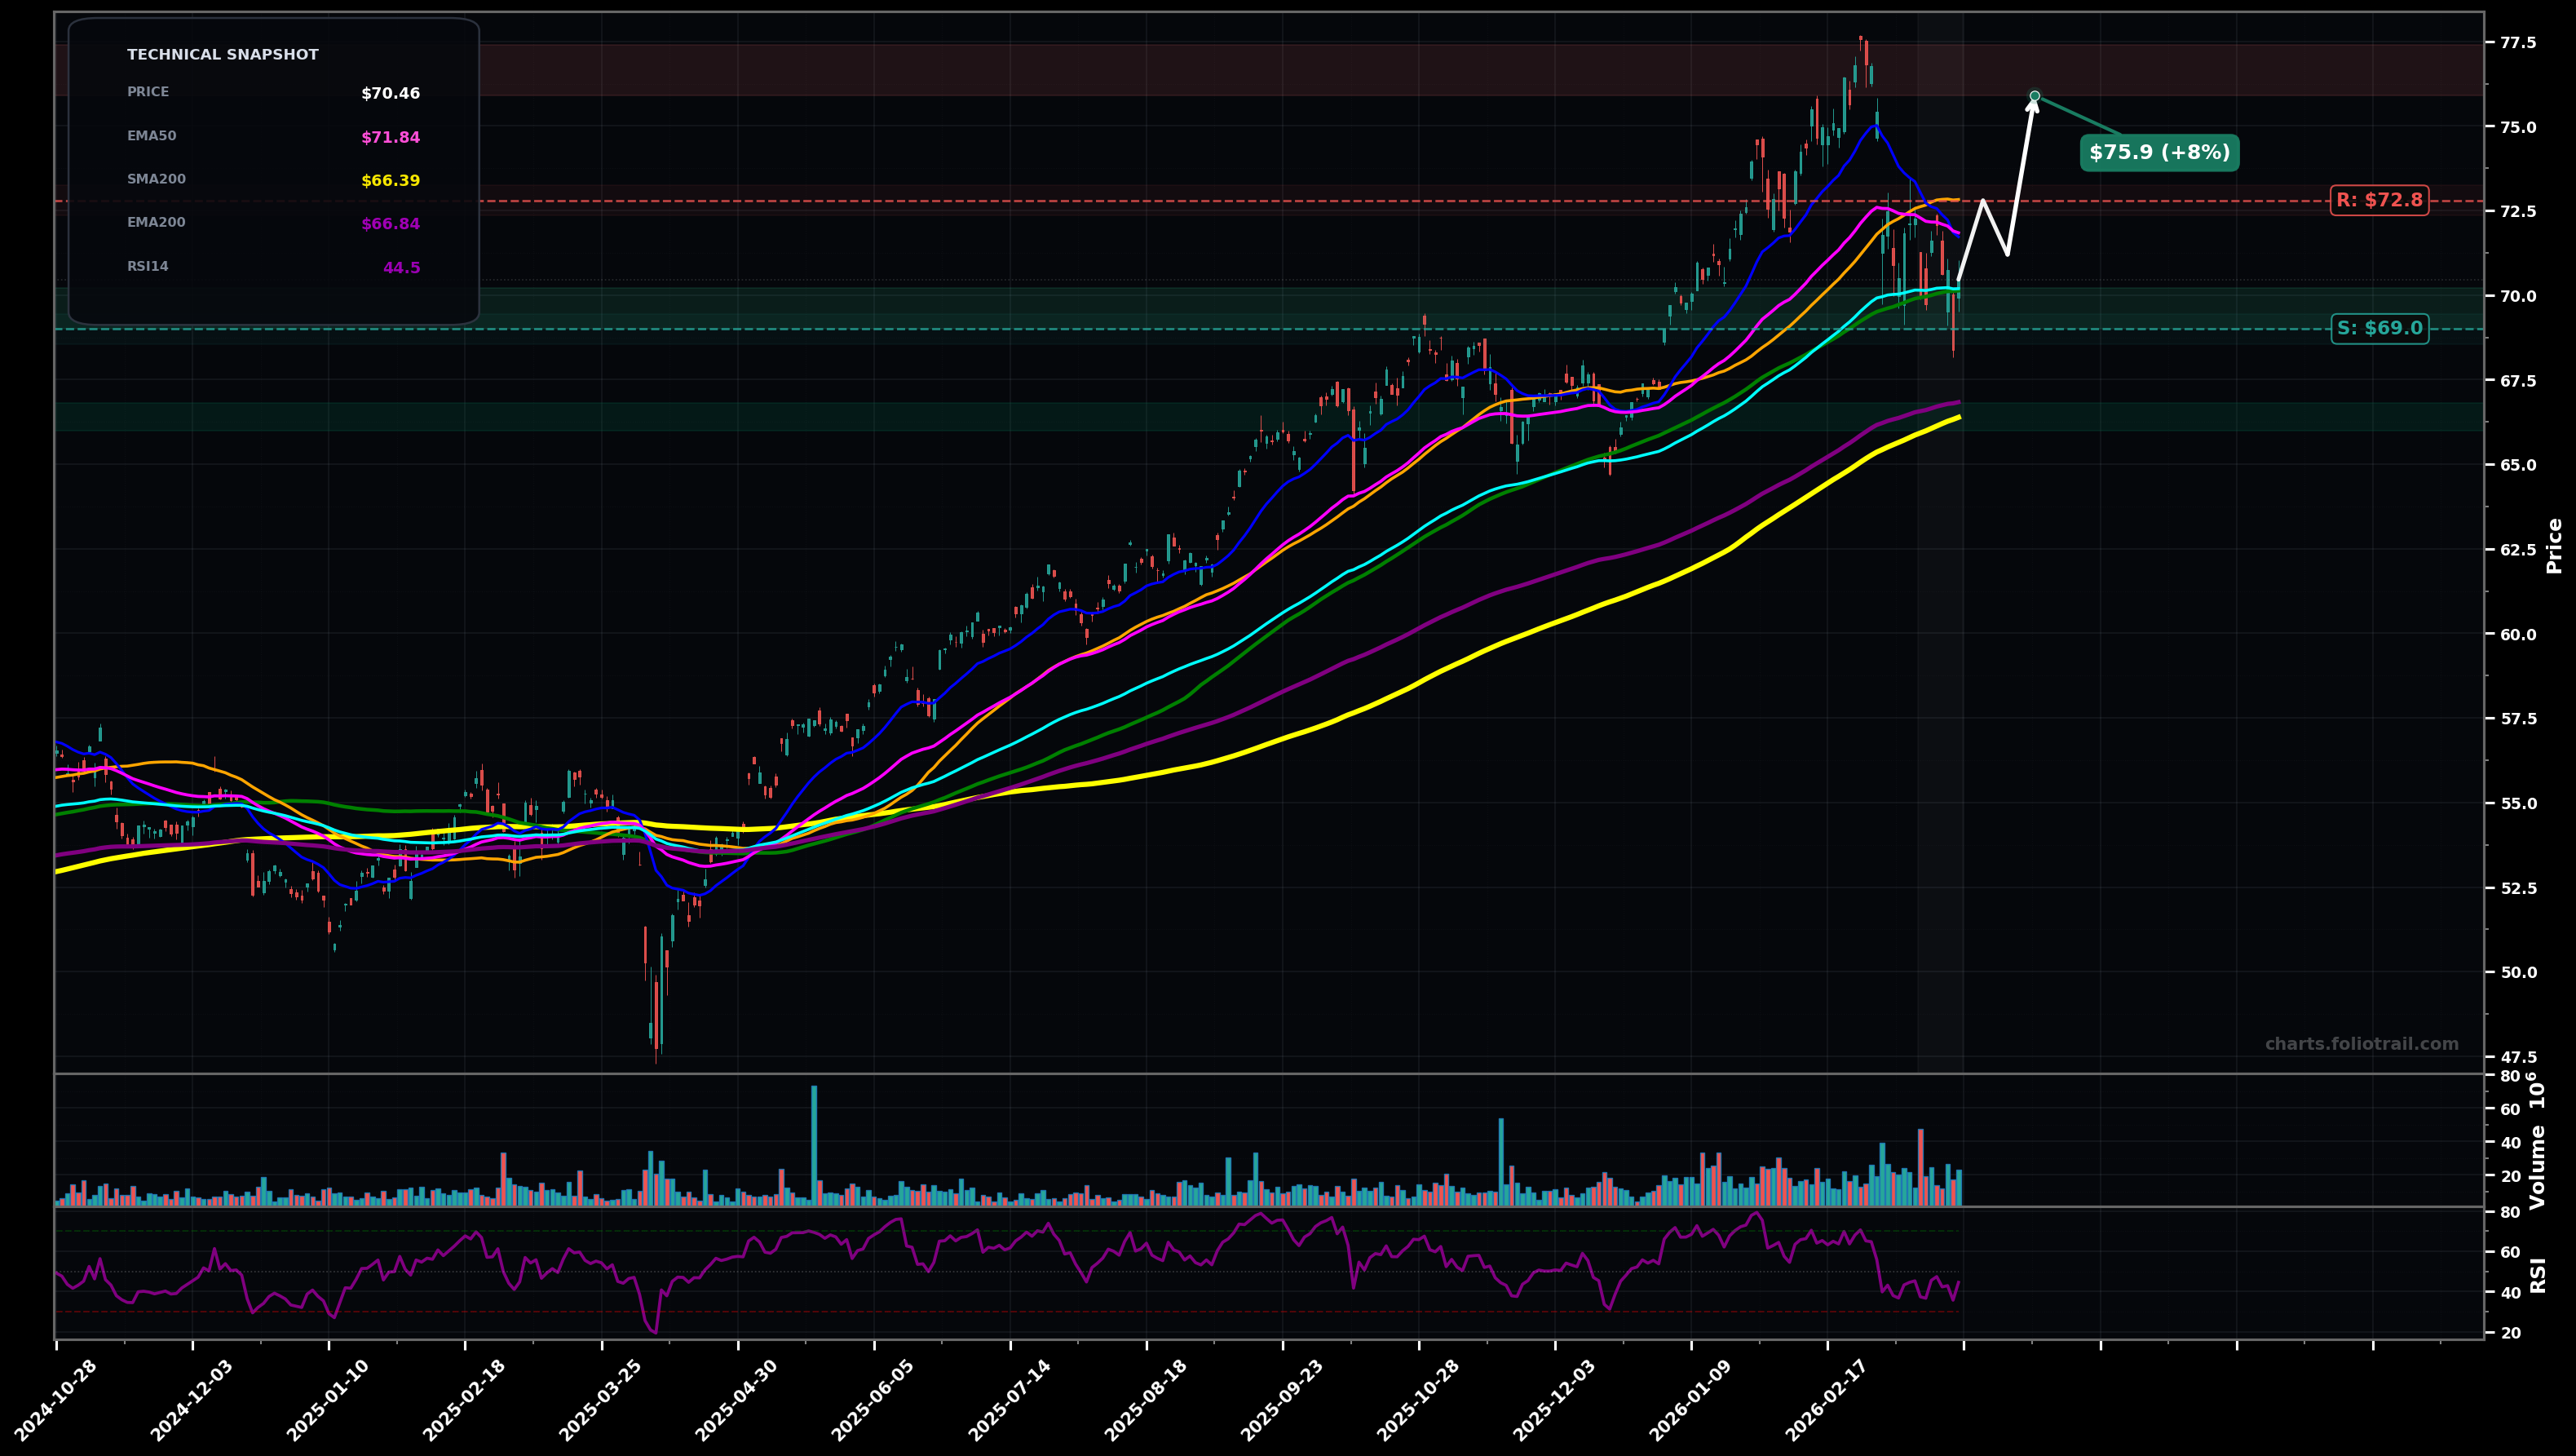
As of March 24, 2026, IEMG (iShares Core MSCI Emerging Markets ETF) is in a bottoming attempt state on the daily chart, with a confidence level of 56%. Key support is at $69.0 and key resistance at $72.8. Sharp pullback from ~$77.4 swing high into the MA cluster; price ~$70.46 now back below SMA50/EMA50/EMA100 with RSI ~44 (momentum cooled).
Base-and-reclaim: price holds ~$69 support, grinds sideways, then reclaims the EMA50/SMA100 zone and retests prior distribution near the mid-$70s. (Elliott: likely wave (4) correction completing; next push would be wave (5) attempt.)
Failure at MA cluster: bounce stalls near ~$72-$73, then breaks $69 support and mean-reverts toward the rising EMA200/SMA200 area. (Fib: pullback toward ~50–61.8% of the last impulse aligns with mid/high-$60s.)
2+ daily closes back above $72.00 (reclaim EMA50/SMA100 area) would confirm a reversal attempt is taking hold
A daily close below $68.80 would invalidate the bottoming attempt and shift odds toward a deeper breakdown
Start near the current swing-low support (~$69) with adds on a breakdown toward the rising EMA200/SMA200 confluence ($66–$68) where a wave-(4)/Fib retrace would more likely complete.
Trim into prior swing-high supply ($76–$77) and progressively derisk if price extends well above the MA ribbon; full close only on a multi-year-style stretch far above trend MAs where upside becomes asymmetric.
As of March 24, 2026, IEMG (iShares Core MSCI Emerging Markets ETF) is in a bottoming attempt state on the daily chart with 56% confidence. Sharp pullback from ~$77.4 swing high into the MA cluster; price ~$70.46 now back below SMA50/EMA50/EMA100 with RSI ~44 (momentum cooled).
On the daily timeframe, IEMG has key support at $69.0 and key resistance at $72.8. The most likely scenario (bullish) targets $72.8 and $75.9, with a revert level at $71.2.
IEMG (iShares Core MSCI Emerging Markets ETF) is currently classified as bottoming attempt on the daily chart, with 56% confidence. Confirmation requires: 2+ daily closes back above $72.00 (reclaim EMA50/SMA100 area) would confirm a reversal attempt is taking hold This would be invalidated by: A daily close below $68.80 would invalidate the bottoming attempt and shift odds toward a deeper breakdown
The most likely scenario (bullish) targets $72.8 and $75.9, with a revert level at $71.2. The alternative scenario (bearish) targets $68.8 and $66.8.
All content on this website — including charts, analysis, price targets, support/resistance levels, and position zones — is generated entirely by AI and provided for educational and informational purposes only.
This is not financial advice. NEXUSNOIR VENTURES SL (the operator of this website) is not a registered investment adviser or broker-dealer. You should not make investment decisions based solely on this information. Always do your own research and consult a qualified financial advisor.
By continuing, you acknowledge that you have read and agree to our full disclaimer & terms of use and privacy policy.