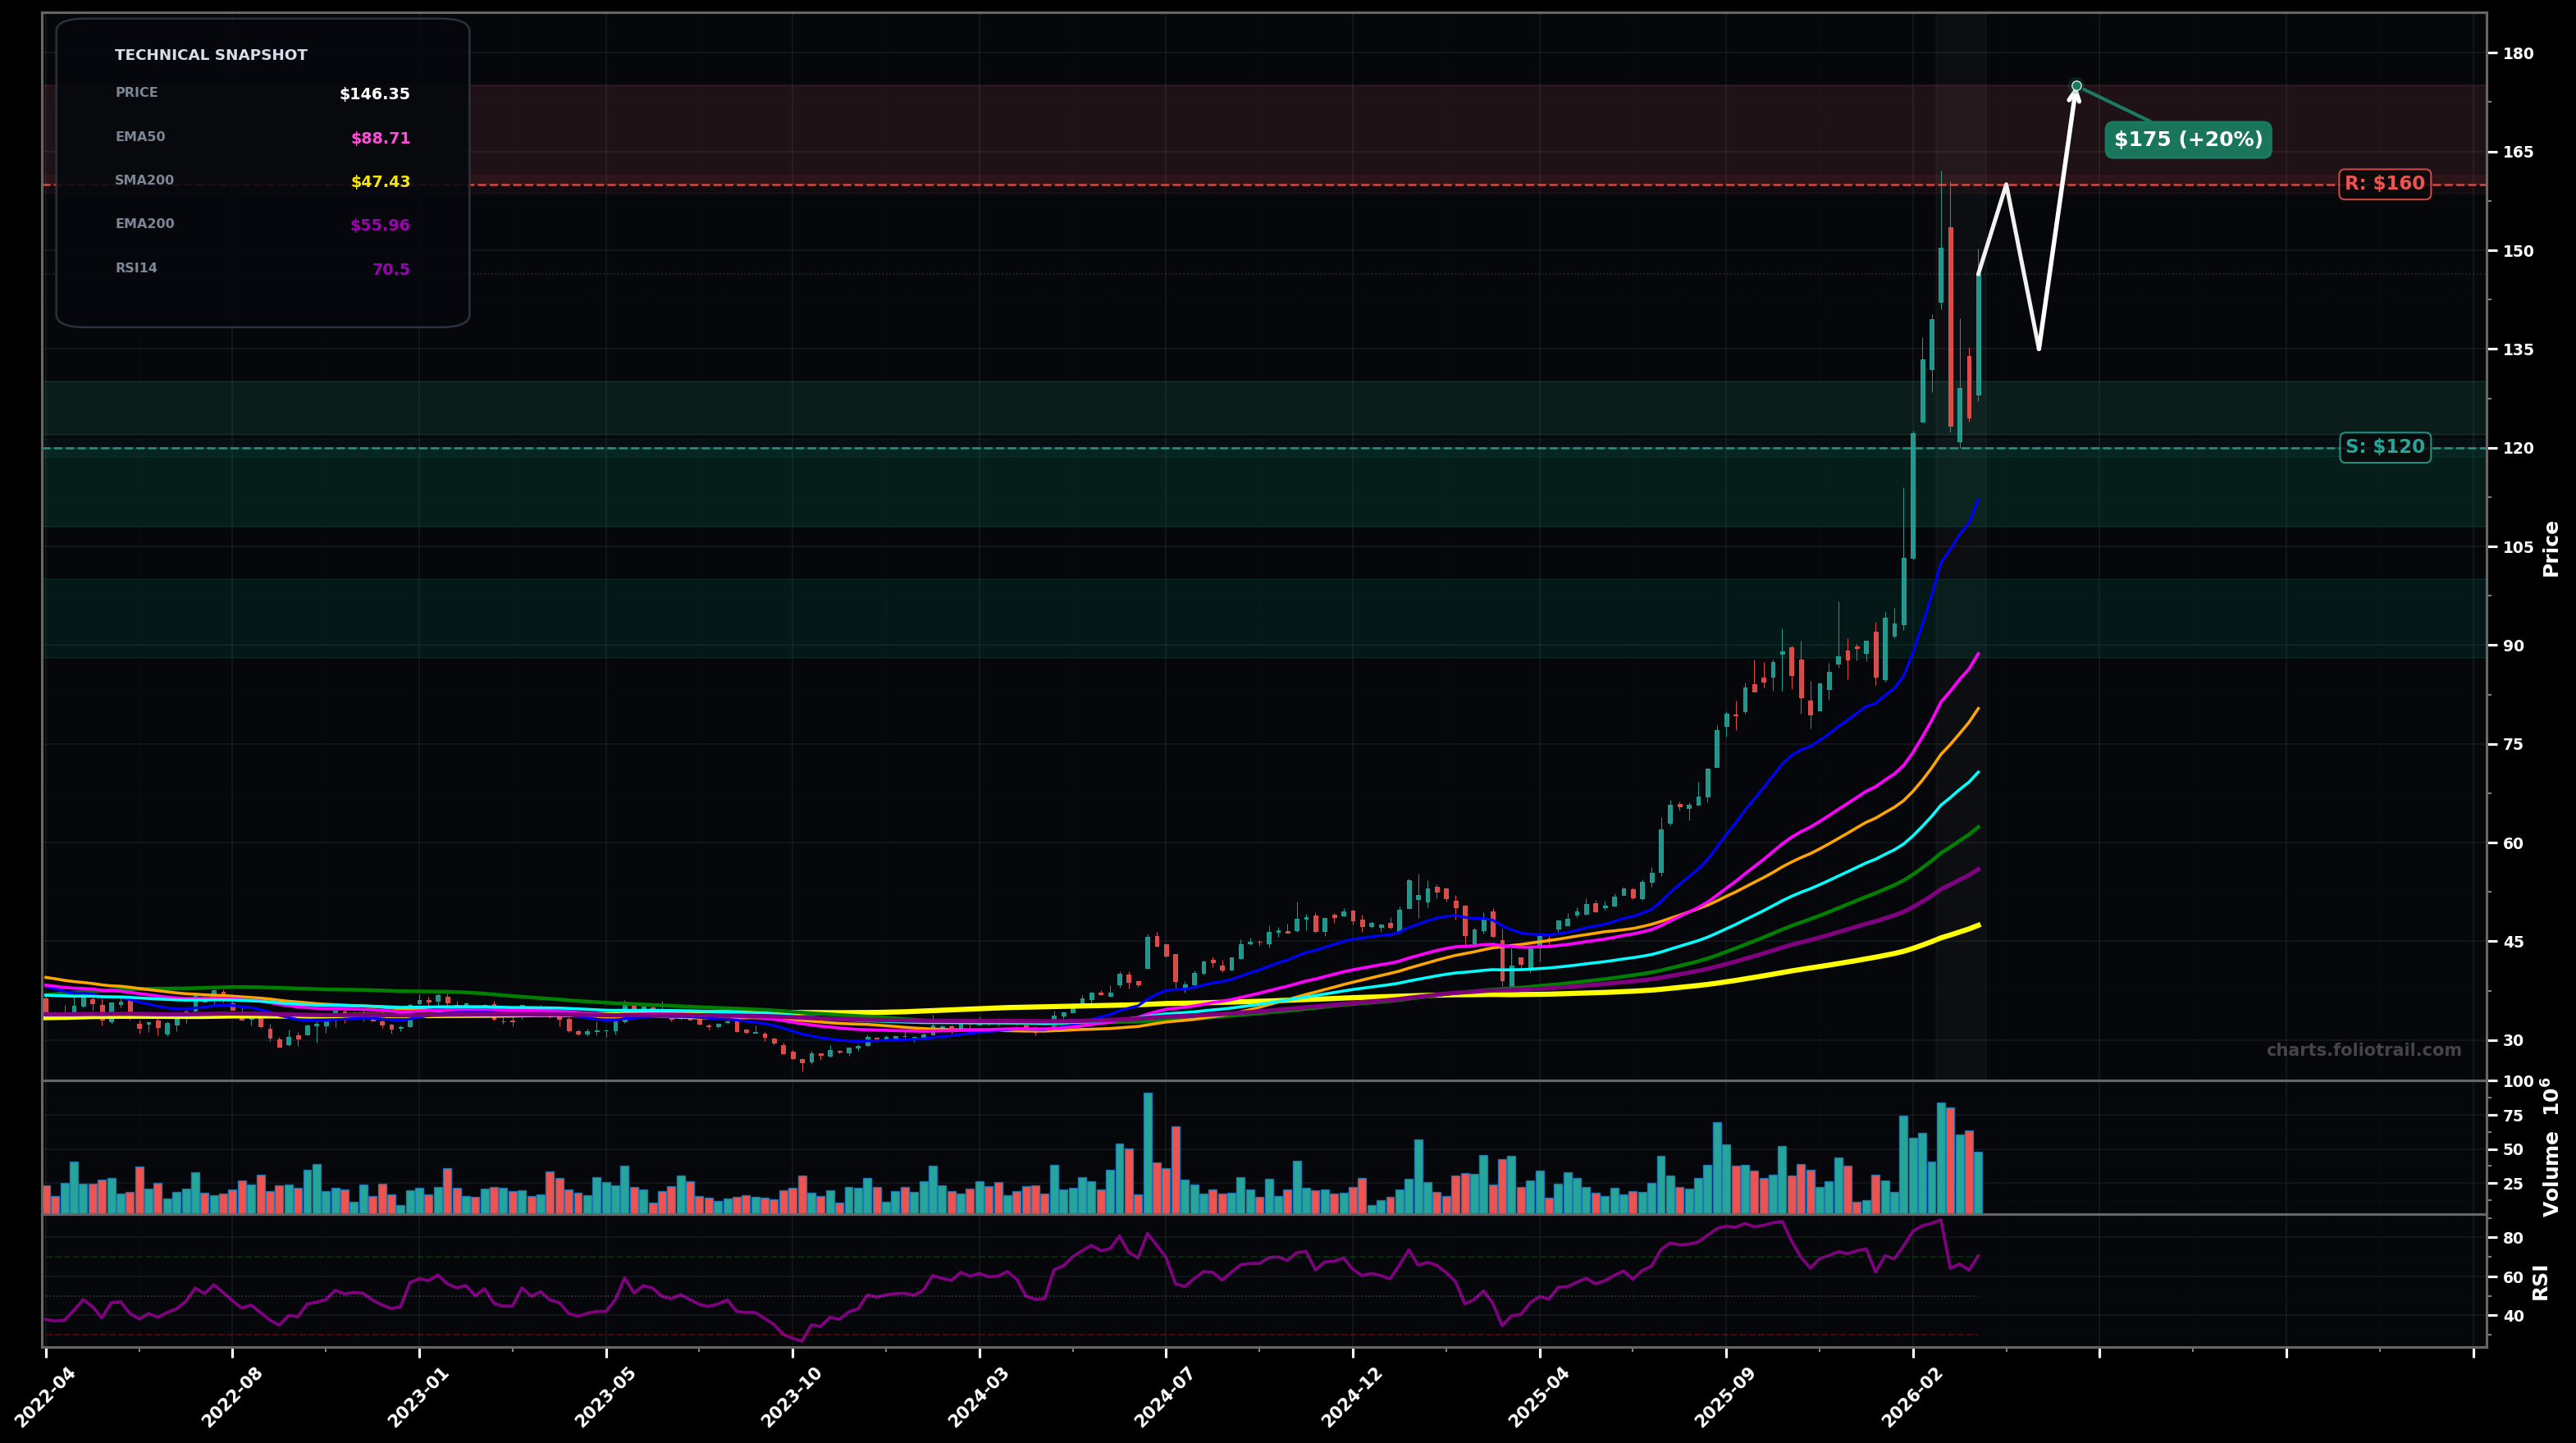
As of March 26, 2026, GLW (Corning Inc.) is in a parabolic state on the weekly chart, with a confidence level of 74%. Key support is at $120 and key resistance at $160. Sharp impulse up into new highs followed by a volatile pullback; price still well above rising EMA50/EMA100 with RSI elevated (~70).
Bullish continuation after a digestion range: holds above the prior breakout zone and re-attempts highs (Elliott: likely still in a late Wave 5 extension; pullback is a Wave 4-type consolidation).
Mean-reversion correction: a deeper Wave 4/ABC retrace toward the fast/mid MAs (and prior consolidation) before any new attempt higher; risk increases if selling prints large red closes near lows.
Weekly close above $160 would confirm the parabolic continuation breakout.
Weekly close below $120 would invalidate the parabolic state and shift toward a deeper correction/base.
Buy-the-dip framework: $122-$130 is first major breakout/structure support; $108-$120 aligns with deeper retrace toward prior swing/volatility shelf; $88-$100 is EMA50-area ($88.71) for a full mean-reversion tag if the correction extends.
Trim into strength: $160-$175 is prior high/extension area; $175-$200 is further Fibonacci-style extension risk zone; $200+ would be extreme multi-year stretch vs the MA stack (EMA50/100/200 and SMA50/100/200).
As of March 26, 2026, GLW (Corning Inc.) is in a parabolic state on the weekly chart with 74% confidence. Sharp impulse up into new highs followed by a volatile pullback; price still well above rising EMA50/EMA100 with RSI elevated (~70).
On the weekly timeframe, GLW has key support at $120 and key resistance at $160. The most likely scenario (bullish) targets $160 and $175, with a revert level at $135.
GLW (Corning Inc.) is currently classified as parabolic on the weekly chart, with 74% confidence. Confirmation requires: Weekly close above $160 would confirm the parabolic continuation breakout. This would be invalidated by: Weekly close below $120 would invalidate the parabolic state and shift toward a deeper correction/base.
The most likely scenario (bullish) targets $160 and $175, with a revert level at $135. The alternative scenario (bearish) targets $120 and $105.
Multi-layer AI agents analyse 200+ stocks across daily, weekly, and monthly timeframes — producing market state classifications, price scenarios with targets, and position entry/exit levels. Updated every trading day after market close. No paywall. No sign-up required.
Built by Foliotrail.
All content on this website — including charts, analysis, price targets, support/resistance levels, and position zones — is generated entirely by AI and provided for educational and informational purposes only.
This is not financial advice. NEXUSNOIR VENTURES SL (the operator of this website) is not a registered investment adviser or broker-dealer. You should not make investment decisions based solely on this information. Always do your own research and consult a qualified financial advisor.
By continuing, you acknowledge that you have read and agree to our full disclaimer & terms of use and privacy policy.