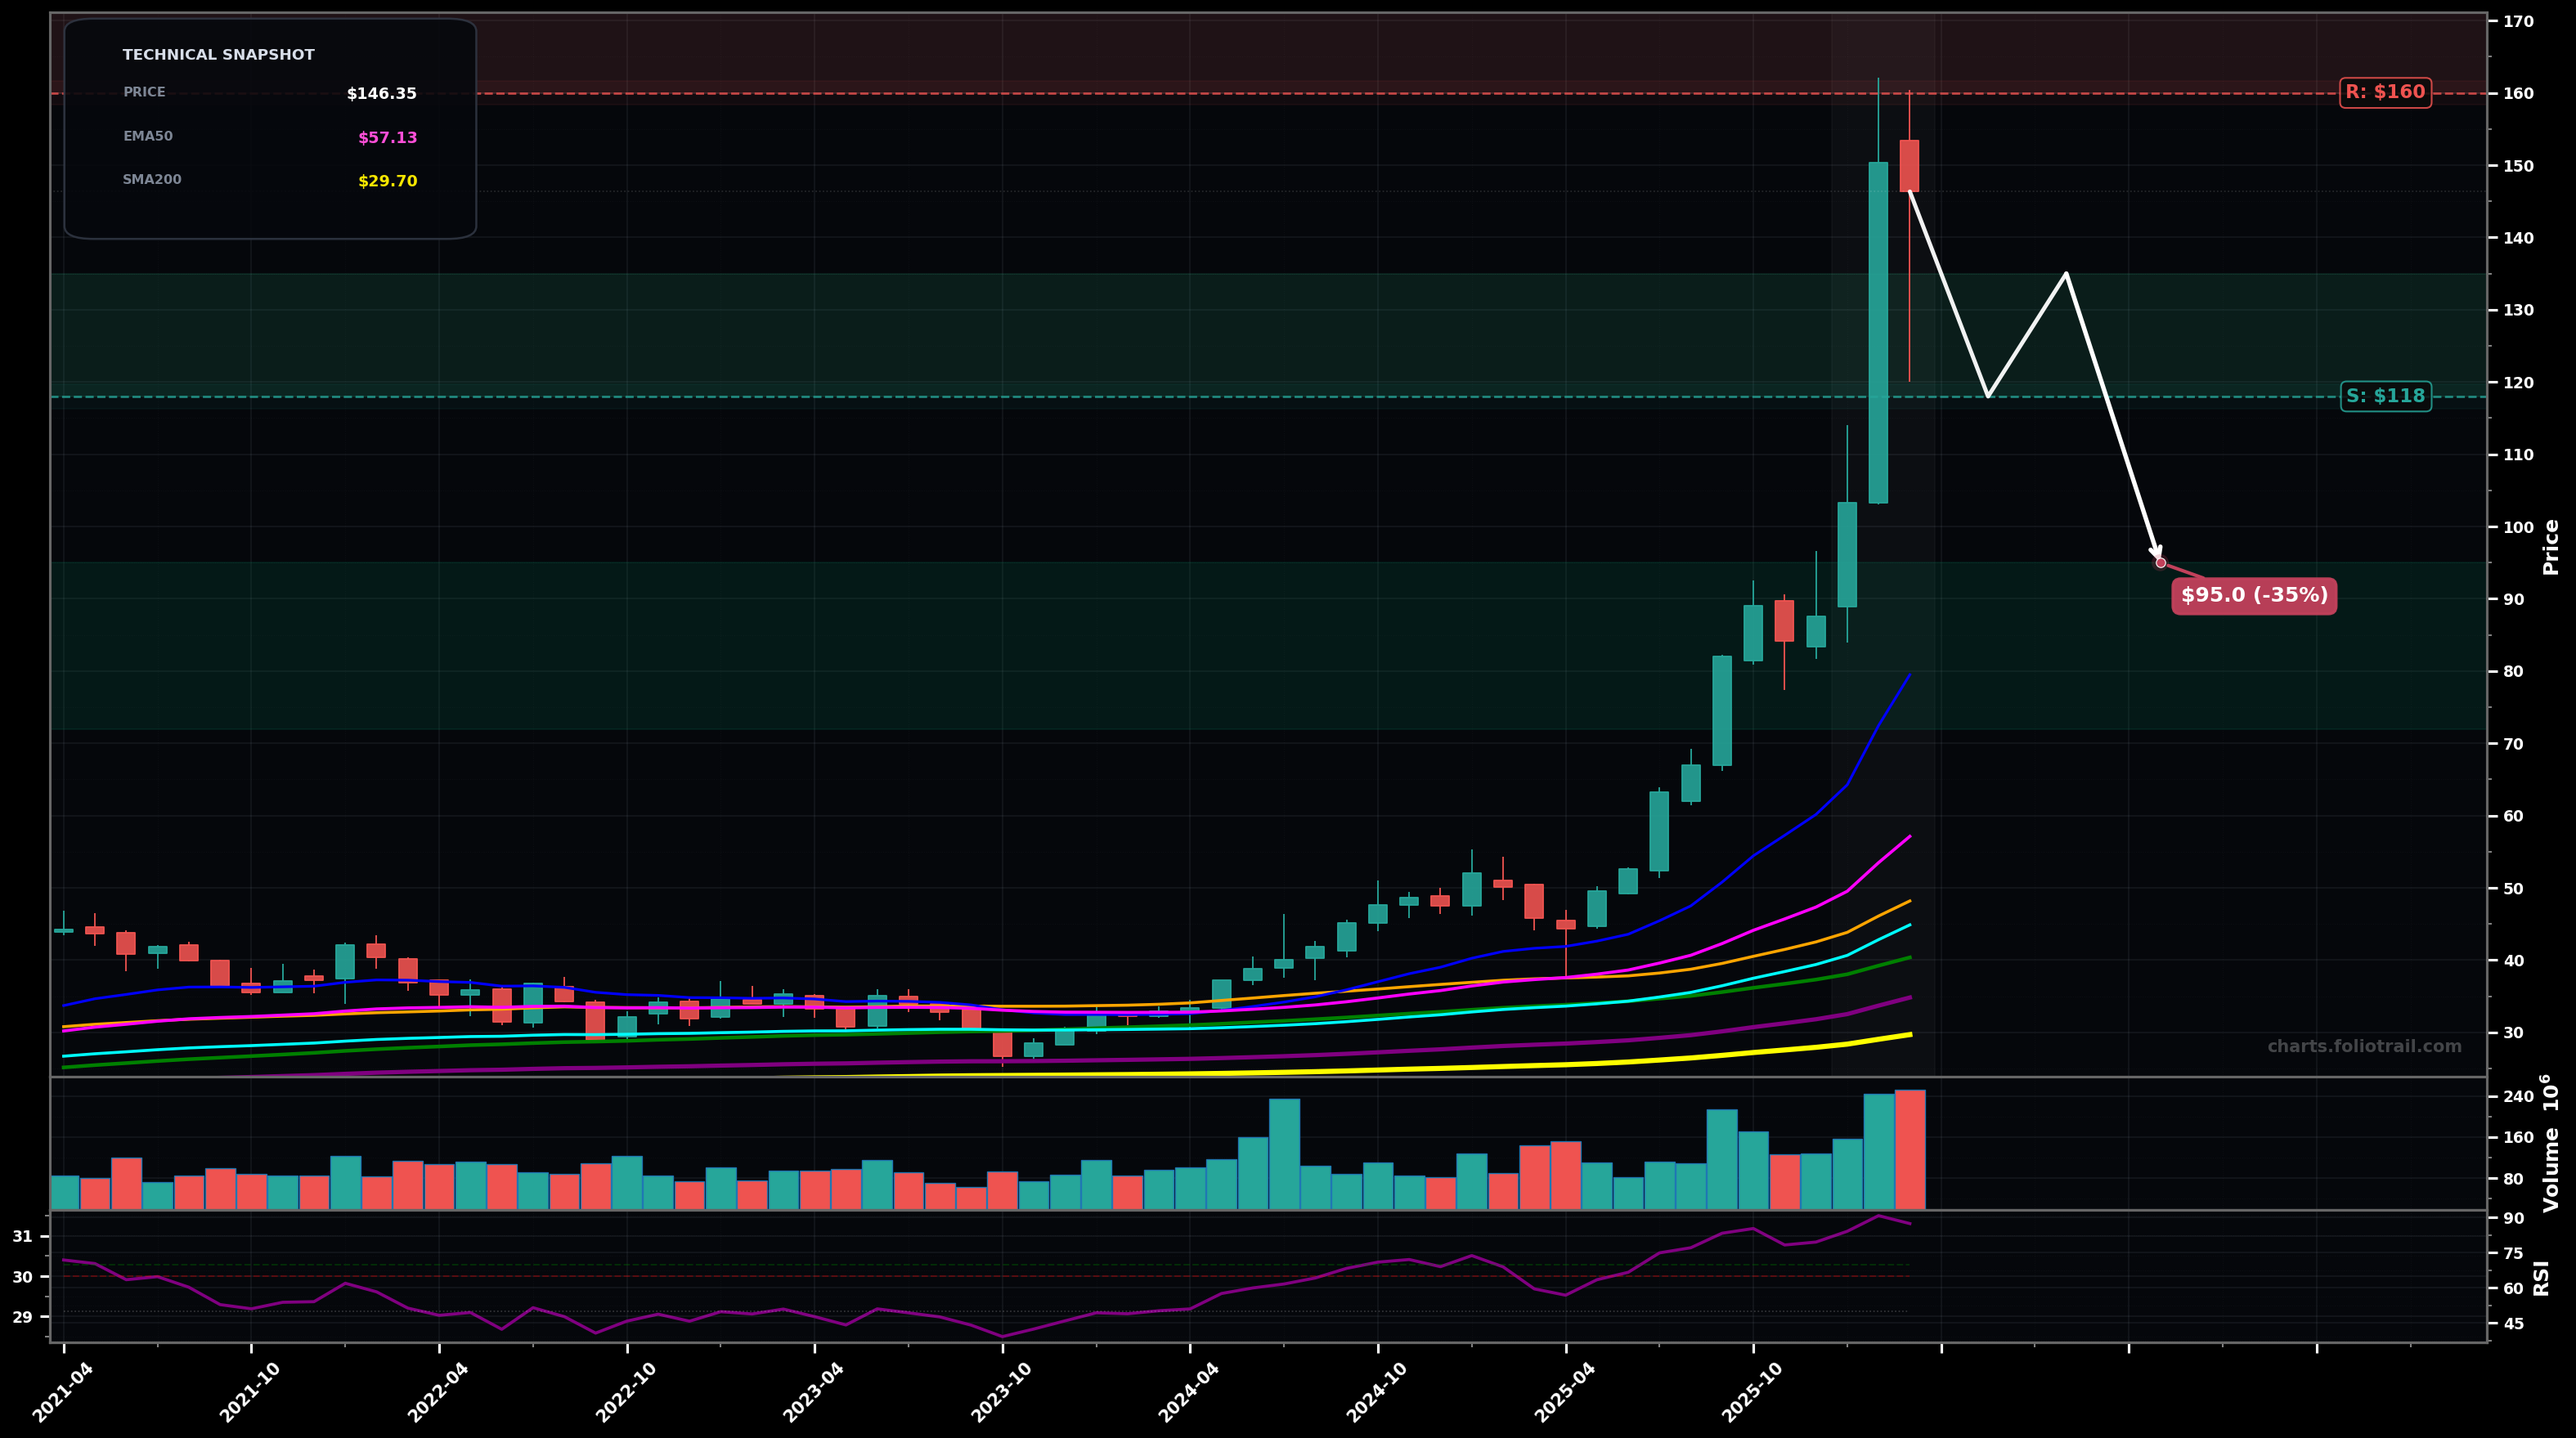
As of March 26, 2026, GLW (Corning Inc.) is in a parabolic state on the monthly chart, with a confidence level of 78%. Key support is at $118 and key resistance at $160. Parabolic monthly rally to ~$160 then pullback; last close ~$146 with very stretched RSI (~87) and price far above all key MAs.
Mean-reversion pullback/sideways digestion: retrace from the spike high and base above prior breakout zone, then attempt a renewed push later.
Blow-off continuation: quick dip gets bought aggressively and price retests/briefly breaks the ~$160 spike high before a larger consolidation.
Monthly close back above ~$155 with a higher high (hold >$155 next month) would confirm continued parabolic squeeze
Monthly close below ~$118 would invalidate parabolic continuation and signal a deeper mean-reversion phase
Buy zones are anchored to the prior breakout/round-number support ($118–$135), then typical Fibonacci-style mean reversion levels from a parabolic leg (~38–50% into $95–$118; deeper 50–61.8% into $72–$95).
With price already far above EMA50/100/200, trims are mapped to likely wave-5 extension zones (new highs above ~$160) where upside becomes increasingly convex and reversal risk rises.
As of March 26, 2026, GLW (Corning Inc.) is in a parabolic state on the monthly chart with 78% confidence. Parabolic monthly rally to ~$160 then pullback; last close ~$146 with very stretched RSI (~87) and price far above all key MAs.
On the monthly timeframe, GLW has key support at $118 and key resistance at $160. The most likely scenario (bearish) targets $118 and $95.0, with a revert level at $135.
GLW (Corning Inc.) is currently classified as parabolic on the monthly chart, with 78% confidence. Confirmation requires: Monthly close back above ~$155 with a higher high (hold >$155 next month) would confirm continued parabolic squeeze This would be invalidated by: Monthly close below ~$118 would invalidate parabolic continuation and signal a deeper mean-reversion phase
The most likely scenario (bearish) targets $118 and $95.0, with a revert level at $135. The alternative scenario (bullish) targets $160 and $180.
Multi-layer AI agents analyse 200+ stocks across daily, weekly, and monthly timeframes — producing market state classifications, price scenarios with targets, and position entry/exit levels. Updated every trading day after market close. No paywall. No sign-up required.
Built by Foliotrail.
All content on this website — including charts, analysis, price targets, support/resistance levels, and position zones — is generated entirely by AI and provided for educational and informational purposes only.
This is not financial advice. NEXUSNOIR VENTURES SL (the operator of this website) is not a registered investment adviser or broker-dealer. You should not make investment decisions based solely on this information. Always do your own research and consult a qualified financial advisor.
By continuing, you acknowledge that you have read and agree to our full disclaimer & terms of use and privacy policy.