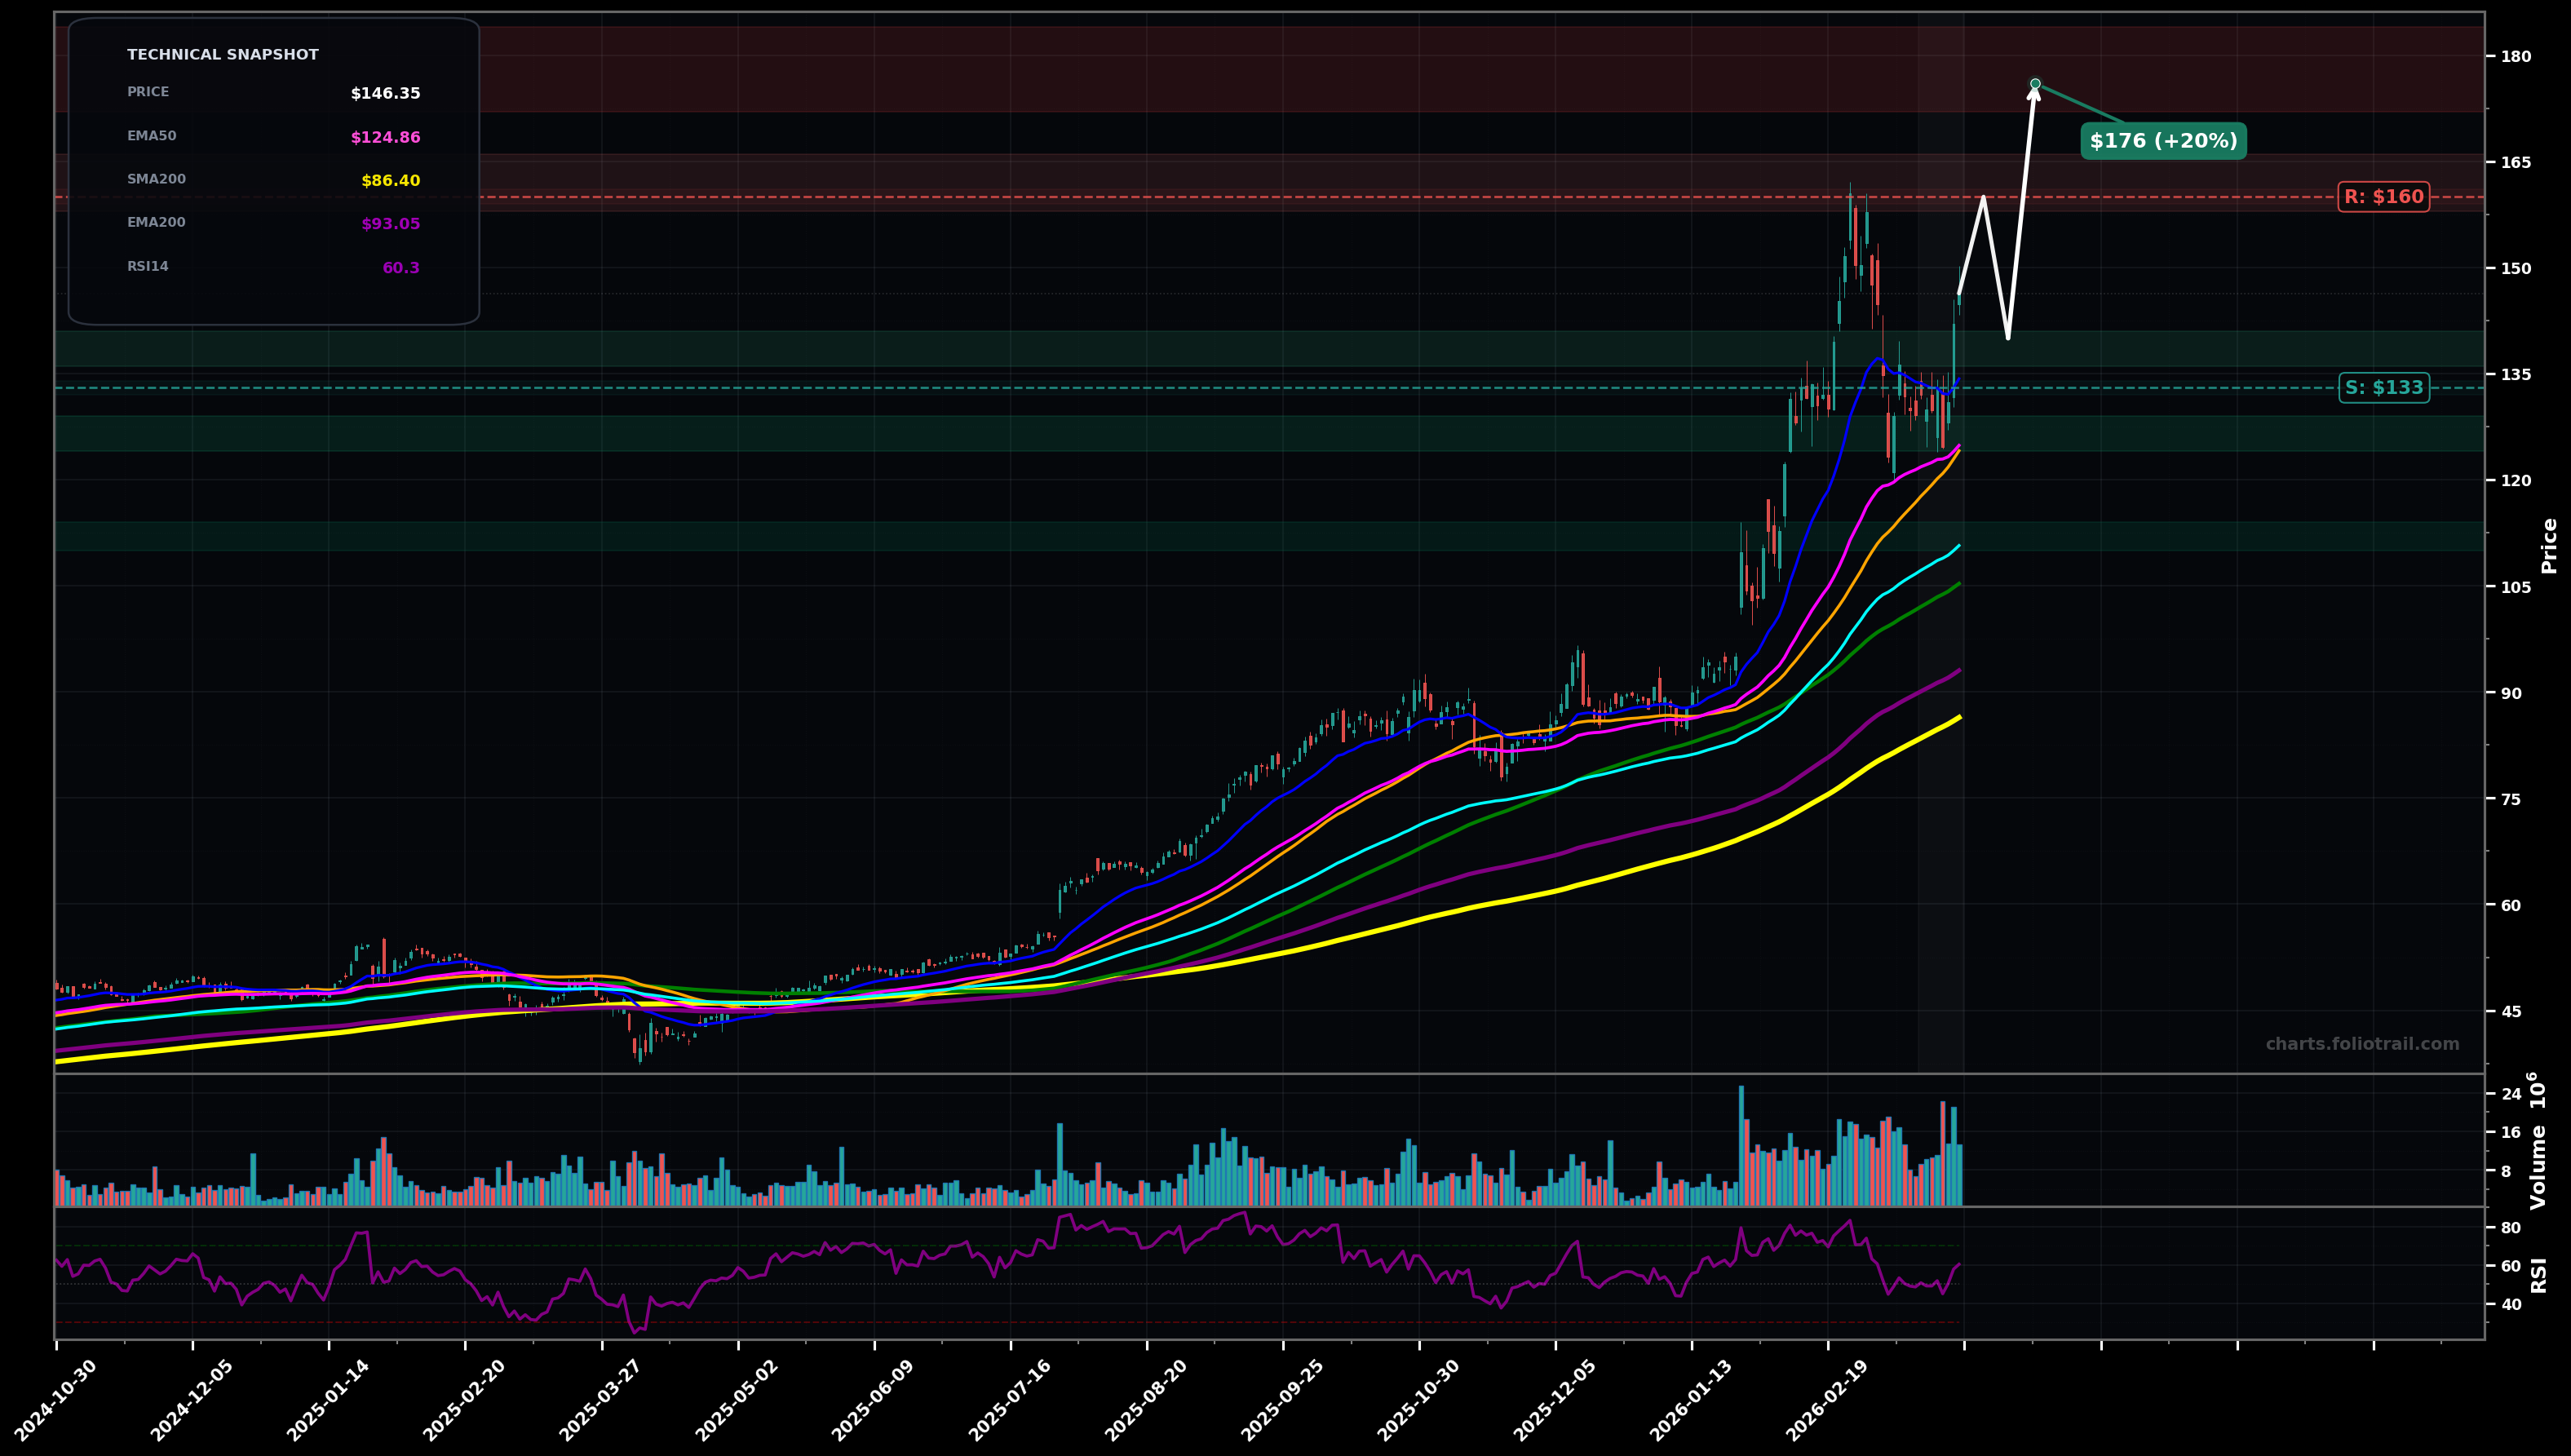
As of March 26, 2026, GLW (Corning Inc.) is in a uptrend state on the daily chart, with a confidence level of 68%. Key support is at $133 and key resistance at $160. Price $146.35 rebounded from a sharp pullback and is back above the rising EMA50 (~$124.86) and prior consolidation band, but still below the recent peak near $160.
Bullish continuation: pullback holds above $133-$136 (gap/structure support) then attempts a re-test of $160; if $160 breaks, a measured move targets the mid-$170s.
Bearish deeper correction: failure to reclaim/hold above the mid-$150s leads to a rollover, breaking $133 and mean-reverting toward the rising EMA100/SMA100 confluence area.
Daily close above $152 followed by a break/close above $160
Daily close below $133 (loss of the recent swing-low zone / prior base support)
Start near prior breakout/HL support (~$136-$141); add on EMA50/SMA50 retest (~$124-$129); heavy add at EMA100 (~$110-$114) if trend stays intact but correction extends.
Trim into resistance/extension: first near prior ATH supply ($158-$166), more on a breakout extension (~$172-$184), and close if price becomes multi-year stretched vs rising long MAs (~$195-$215).
As of March 26, 2026, GLW (Corning Inc.) is in a uptrend state on the daily chart with 68% confidence. Price $146.35 rebounded from a sharp pullback and is back above the rising EMA50 (~$124.86) and prior consolidation band, but still below the recent peak near $160.
On the daily timeframe, GLW has key support at $133 and key resistance at $160. The most likely scenario (bullish) targets $160 and $176, with a revert level at $140.
GLW (Corning Inc.) is currently classified as uptrend on the daily chart, with 68% confidence. Confirmation requires: Daily close above $152 followed by a break/close above $160 This would be invalidated by: Daily close below $133 (loss of the recent swing-low zone / prior base support)
The most likely scenario (bullish) targets $160 and $176, with a revert level at $140. The alternative scenario (bearish) targets $133 and $112.
Multi-layer AI agents analyse 200+ stocks across daily, weekly, and monthly timeframes — producing market state classifications, price scenarios with targets, and position entry/exit levels. Updated every trading day after market close. No paywall. No sign-up required.
Built by Foliotrail.
All content on this website — including charts, analysis, price targets, support/resistance levels, and position zones — is generated entirely by AI and provided for educational and informational purposes only.
This is not financial advice. NEXUSNOIR VENTURES SL (the operator of this website) is not a registered investment adviser or broker-dealer. You should not make investment decisions based solely on this information. Always do your own research and consult a qualified financial advisor.
By continuing, you acknowledge that you have read and agree to our full disclaimer & terms of use and privacy policy.