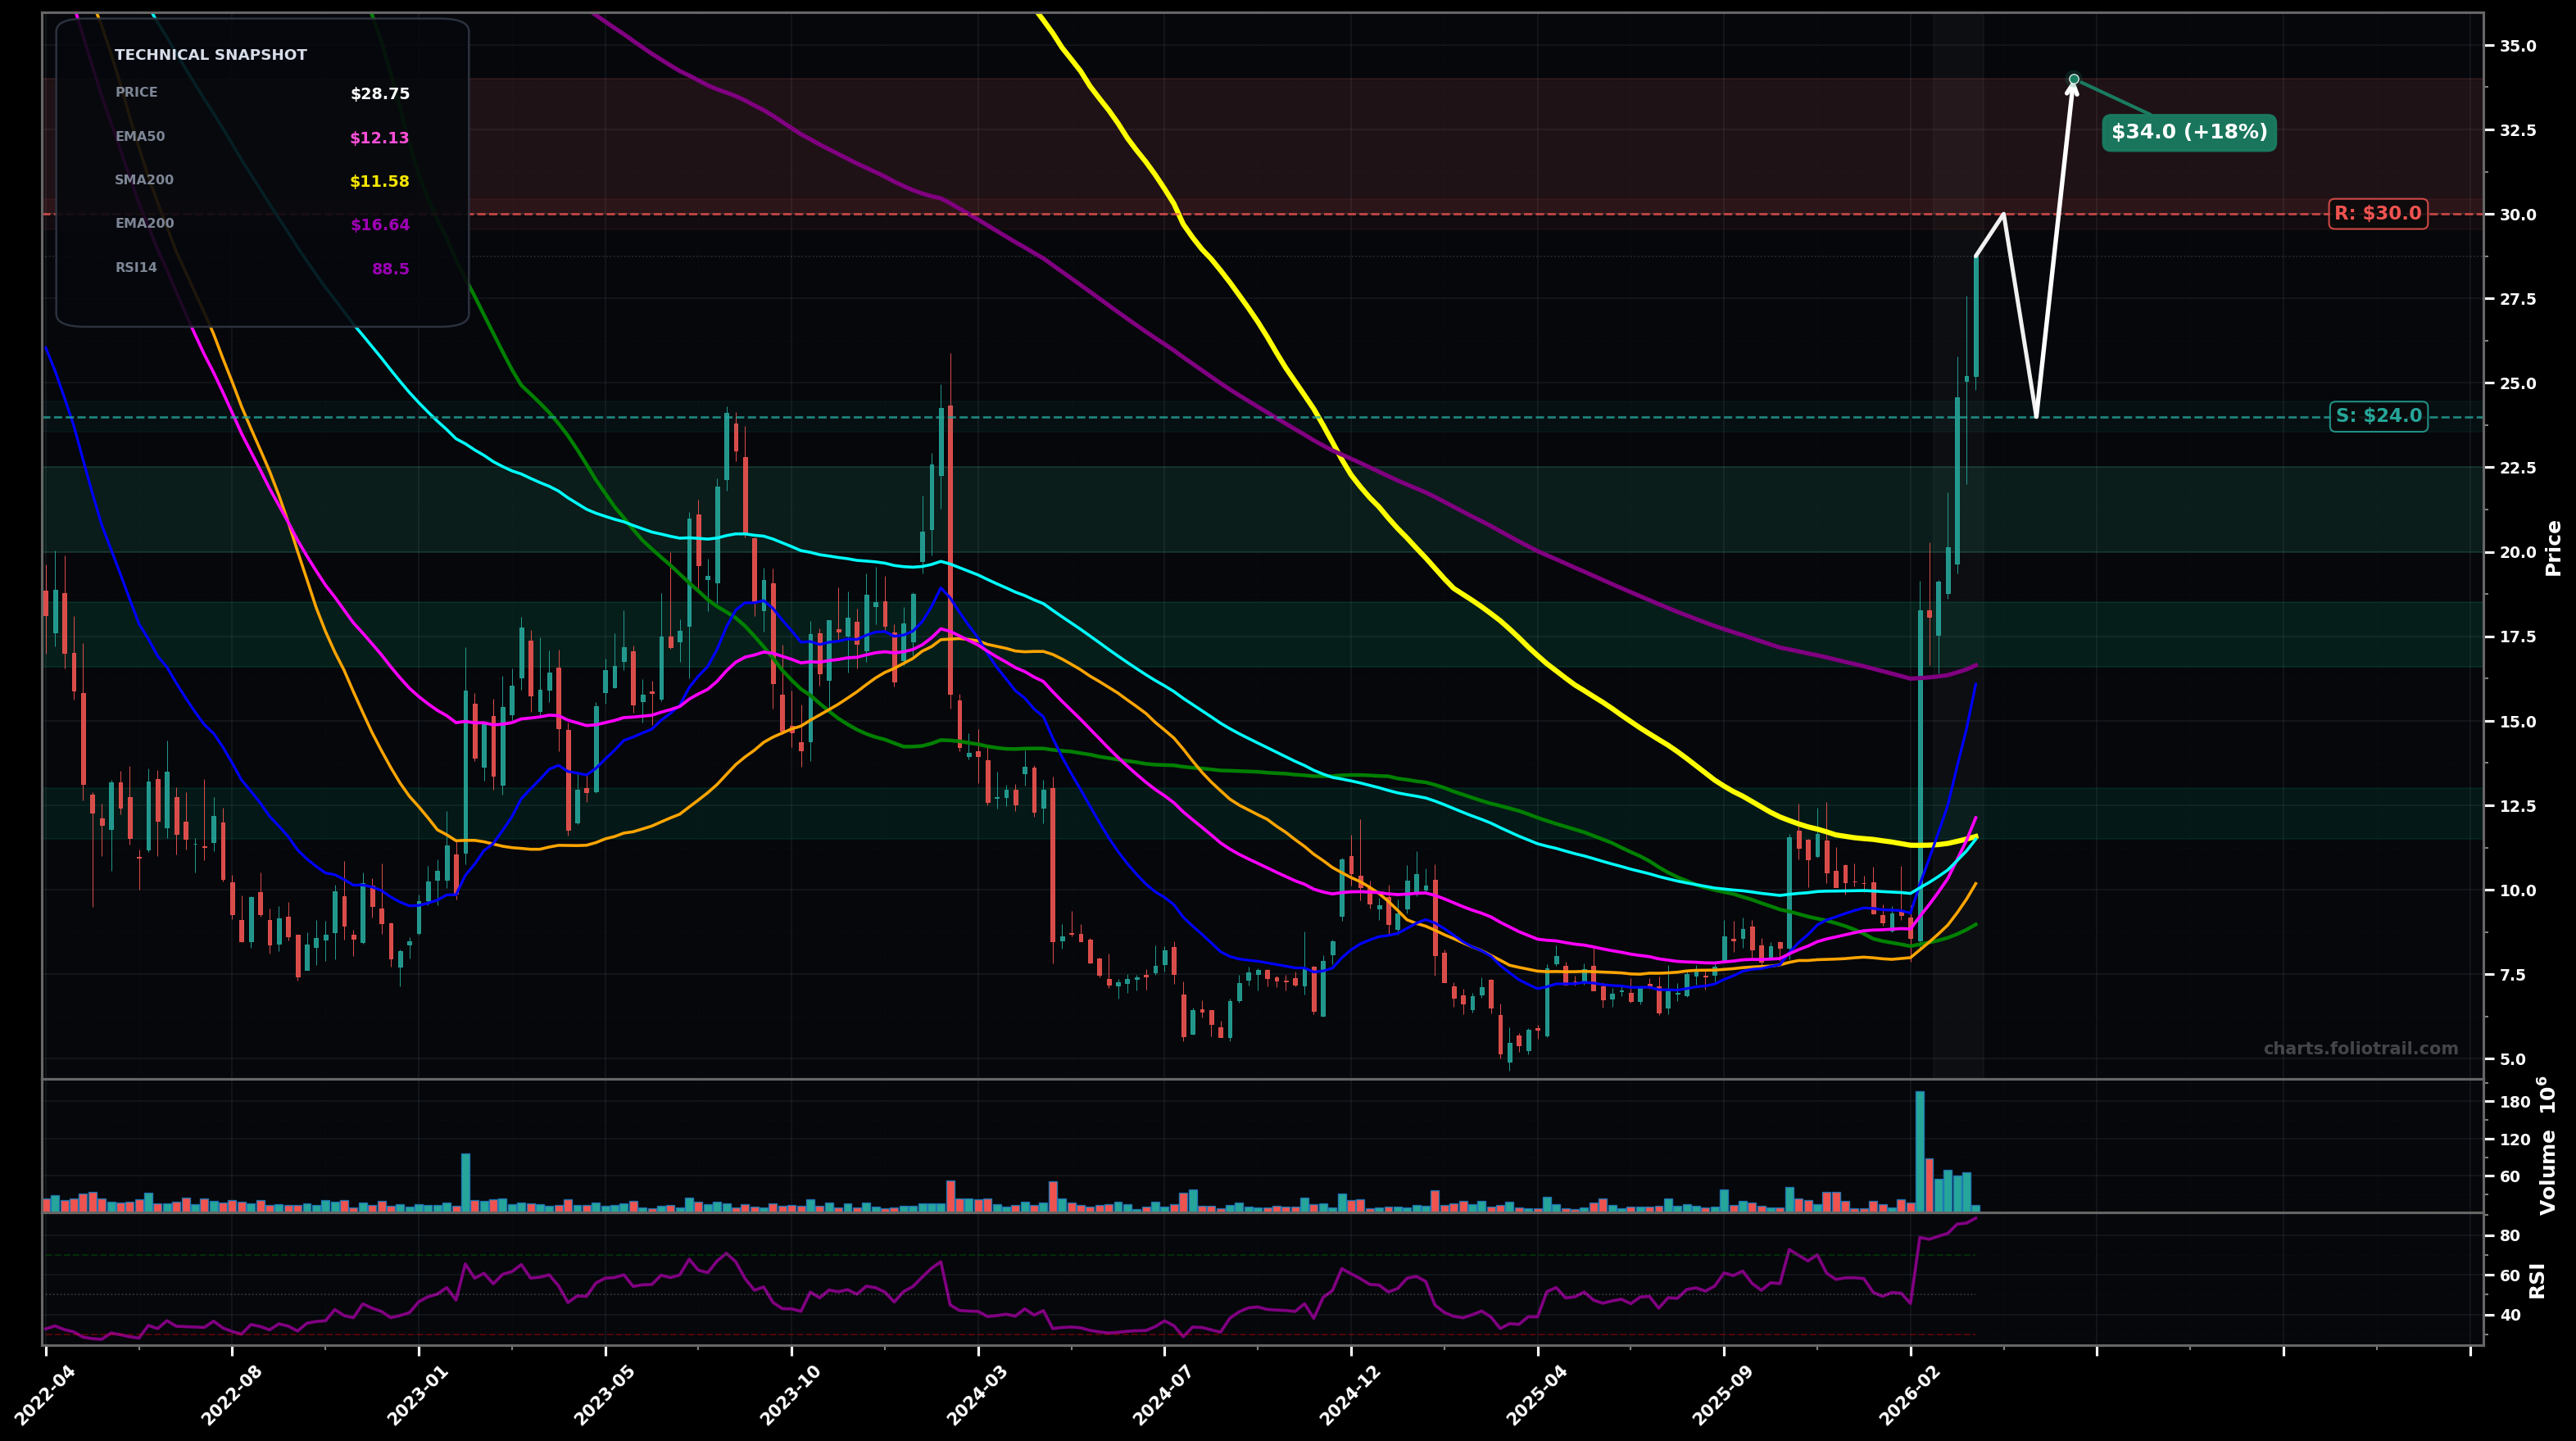
As of March 24, 2026, FSLY (Fastly Inc.) is in a parabolic state on the weekly chart, with a confidence level of 78%. Key support is at $24.0 and key resistance at $30.0. Explosive weekly breakout with vertical follow-through; price ~$28.75 far above all key MAs, volume spike, RSI extremely overbought (~88).
Bullish continuation: this looks like an impulsive Elliott Wave advance (likely Wave 3 extension) after a long base; price consolidates briefly (flag) above prior breakout zone, then pushes to the next fib extension area.
Mean-reversion pullback: parabolic move fades into a sharp Wave 4-style retrace/ABC back toward reclaimed long MAs (first EMA200, then EMA100/EMA50 cluster) before trying to resume uptrend.
Hold above $24.00 on weekly closes (2+ closes) while EMA50 keeps rising
Weekly close below $16.60 (EMA200 purple) would end the parabolic structure and imply deeper mean reversion
Buy-the-dip zones aligned to likely Wave-4/ABC retrace + fib/structure: $20-$22.5 prior breakout/flag area, $16.6-$18.5 EMA200 (purple) retest, $11.5-$13 former base + EMA50/EMA100 region if momentum fully mean-reverts.
With RSI extremely stretched and price far above rising MAs, trim into fib-extension/round-number supply zones; scale heavier if price becomes increasingly disconnected from EMA50/EMA100 and weekly candles show topping wicks/failed follow-through.
As of March 24, 2026, FSLY (Fastly Inc.) is in a parabolic state on the weekly chart with 78% confidence. Explosive weekly breakout with vertical follow-through; price ~$28.75 far above all key MAs, volume spike, RSI extremely overbought (~88).
On the weekly timeframe, FSLY has key support at $24.0 and key resistance at $30.0. The most likely scenario (bullish) targets $30.0 and $34.0, with a revert level at $24.0.
FSLY (Fastly Inc.) is currently classified as parabolic on the weekly chart, with 78% confidence. Confirmation requires: Hold above $24.00 on weekly closes (2+ closes) while EMA50 keeps rising This would be invalidated by: Weekly close below $16.60 (EMA200 purple) would end the parabolic structure and imply deeper mean reversion
The most likely scenario (bullish) targets $30.0 and $34.0, with a revert level at $24.0. The alternative scenario (bearish) targets $20.0 and $16.6.
All content on this website — including charts, analysis, price targets, support/resistance levels, and position zones — is generated entirely by AI and provided for educational and informational purposes only.
This is not financial advice. NEXUSNOIR VENTURES SL (the operator of this website) is not a registered investment adviser or broker-dealer. You should not make investment decisions based solely on this information. Always do your own research and consult a qualified financial advisor.
By continuing, you acknowledge that you have read and agree to our full disclaimer & terms of use and privacy policy.