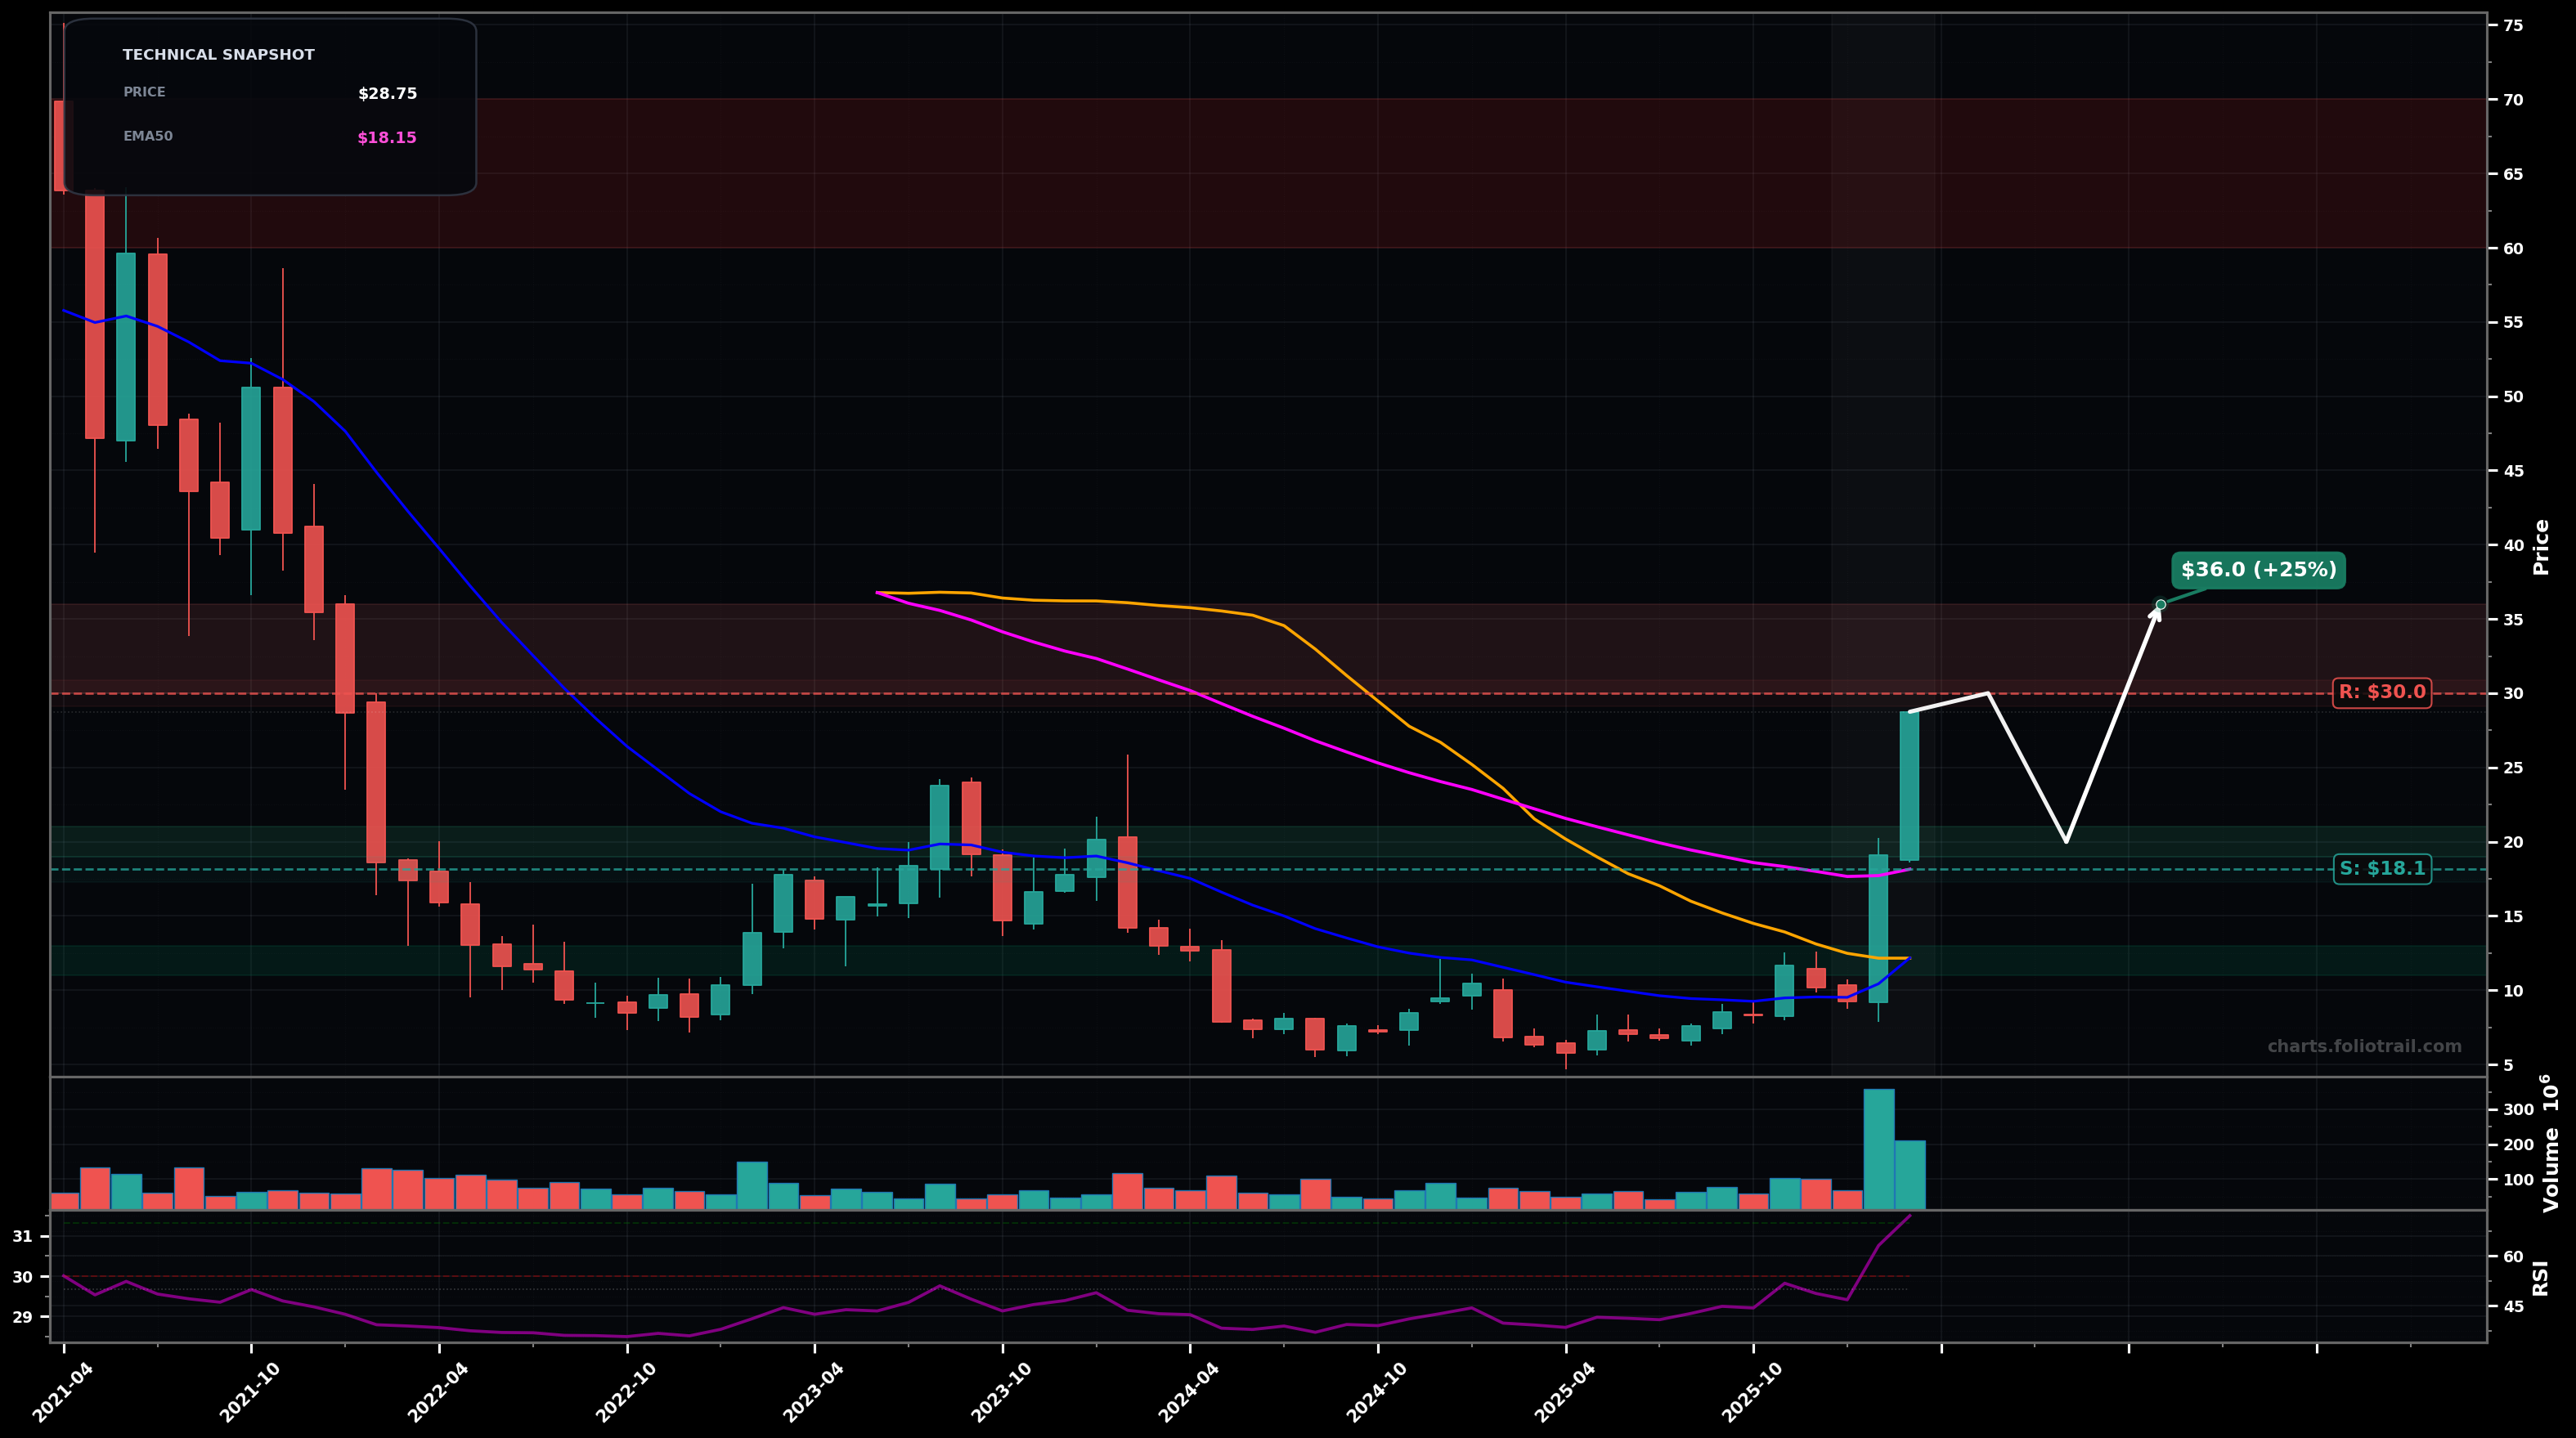
As of March 24, 2026, FSLY (Fastly Inc.) is in a breakout reversal state on the monthly chart, with a confidence level of 67%. Key support is at $18.1 and key resistance at $30.0. Monthly volatility expansion with a breakout candle to ~$28.75 on very high volume; price cleared the falling EMA50 (~$18.15) and is pressing into the next MA band.
Bullish continuation after a brief consolidation: breakout holds above the reclaimed EMA50 and pushes into the next overhead supply/MA zone (likely EMA100/SMA50 cluster), with a retest of the breakout area possible before the next leg.
Bearish mean-reversion: after an overbought monthly thrust, price fades back to retest the breakout/MA reclaim; failure to hold produces a return toward the prior base and deeper support.
Hold 2+ monthly closes above ~$18.15 (EMA50) and above ~$20.00 (prior pivot supply) while keeping the next pullback HL above ~$14.00.
Monthly close back below ~$18.15 (EMA50) with follow-through toward ~$14.00.
Start on controlled retest of breakout ($20 area); add on EMA50 reclaim support band; heavy add only if a full mean-reversion returns price to the prior base/major MA area near ~$12.
Trim into overhead multi-year supply/likely Fib clusters (first ~$30–$36), then stronger trims into prior distribution zones (~$44–$52), and full exit if price revisits extreme prior-cycle supply (~$60–$70).
As of March 24, 2026, FSLY (Fastly Inc.) is in a breakout reversal state on the monthly chart with 67% confidence. Monthly volatility expansion with a breakout candle to ~$28.75 on very high volume; price cleared the falling EMA50 (~$18.15) and is pressing into the next MA band.
On the monthly timeframe, FSLY has key support at $18.1 and key resistance at $30.0. The most likely scenario (bullish) targets $30.0 and $36.0, with a revert level at $20.0.
FSLY (Fastly Inc.) is currently classified as breakout reversal on the monthly chart, with 67% confidence. Confirmation requires: Hold 2+ monthly closes above ~$18.15 (EMA50) and above ~$20.00 (prior pivot supply) while keeping the next pullback HL above ~$14.00. This would be invalidated by: Monthly close back below ~$18.15 (EMA50) with follow-through toward ~$14.00.
The most likely scenario (bullish) targets $30.0 and $36.0, with a revert level at $20.0. The alternative scenario (bearish) targets $18.1 and $12.0.
All content on this website — including charts, analysis, price targets, support/resistance levels, and position zones — is generated entirely by AI and provided for educational and informational purposes only.
This is not financial advice. NEXUSNOIR VENTURES SL (the operator of this website) is not a registered investment adviser or broker-dealer. You should not make investment decisions based solely on this information. Always do your own research and consult a qualified financial advisor.
By continuing, you acknowledge that you have read and agree to our full disclaimer & terms of use and privacy policy.