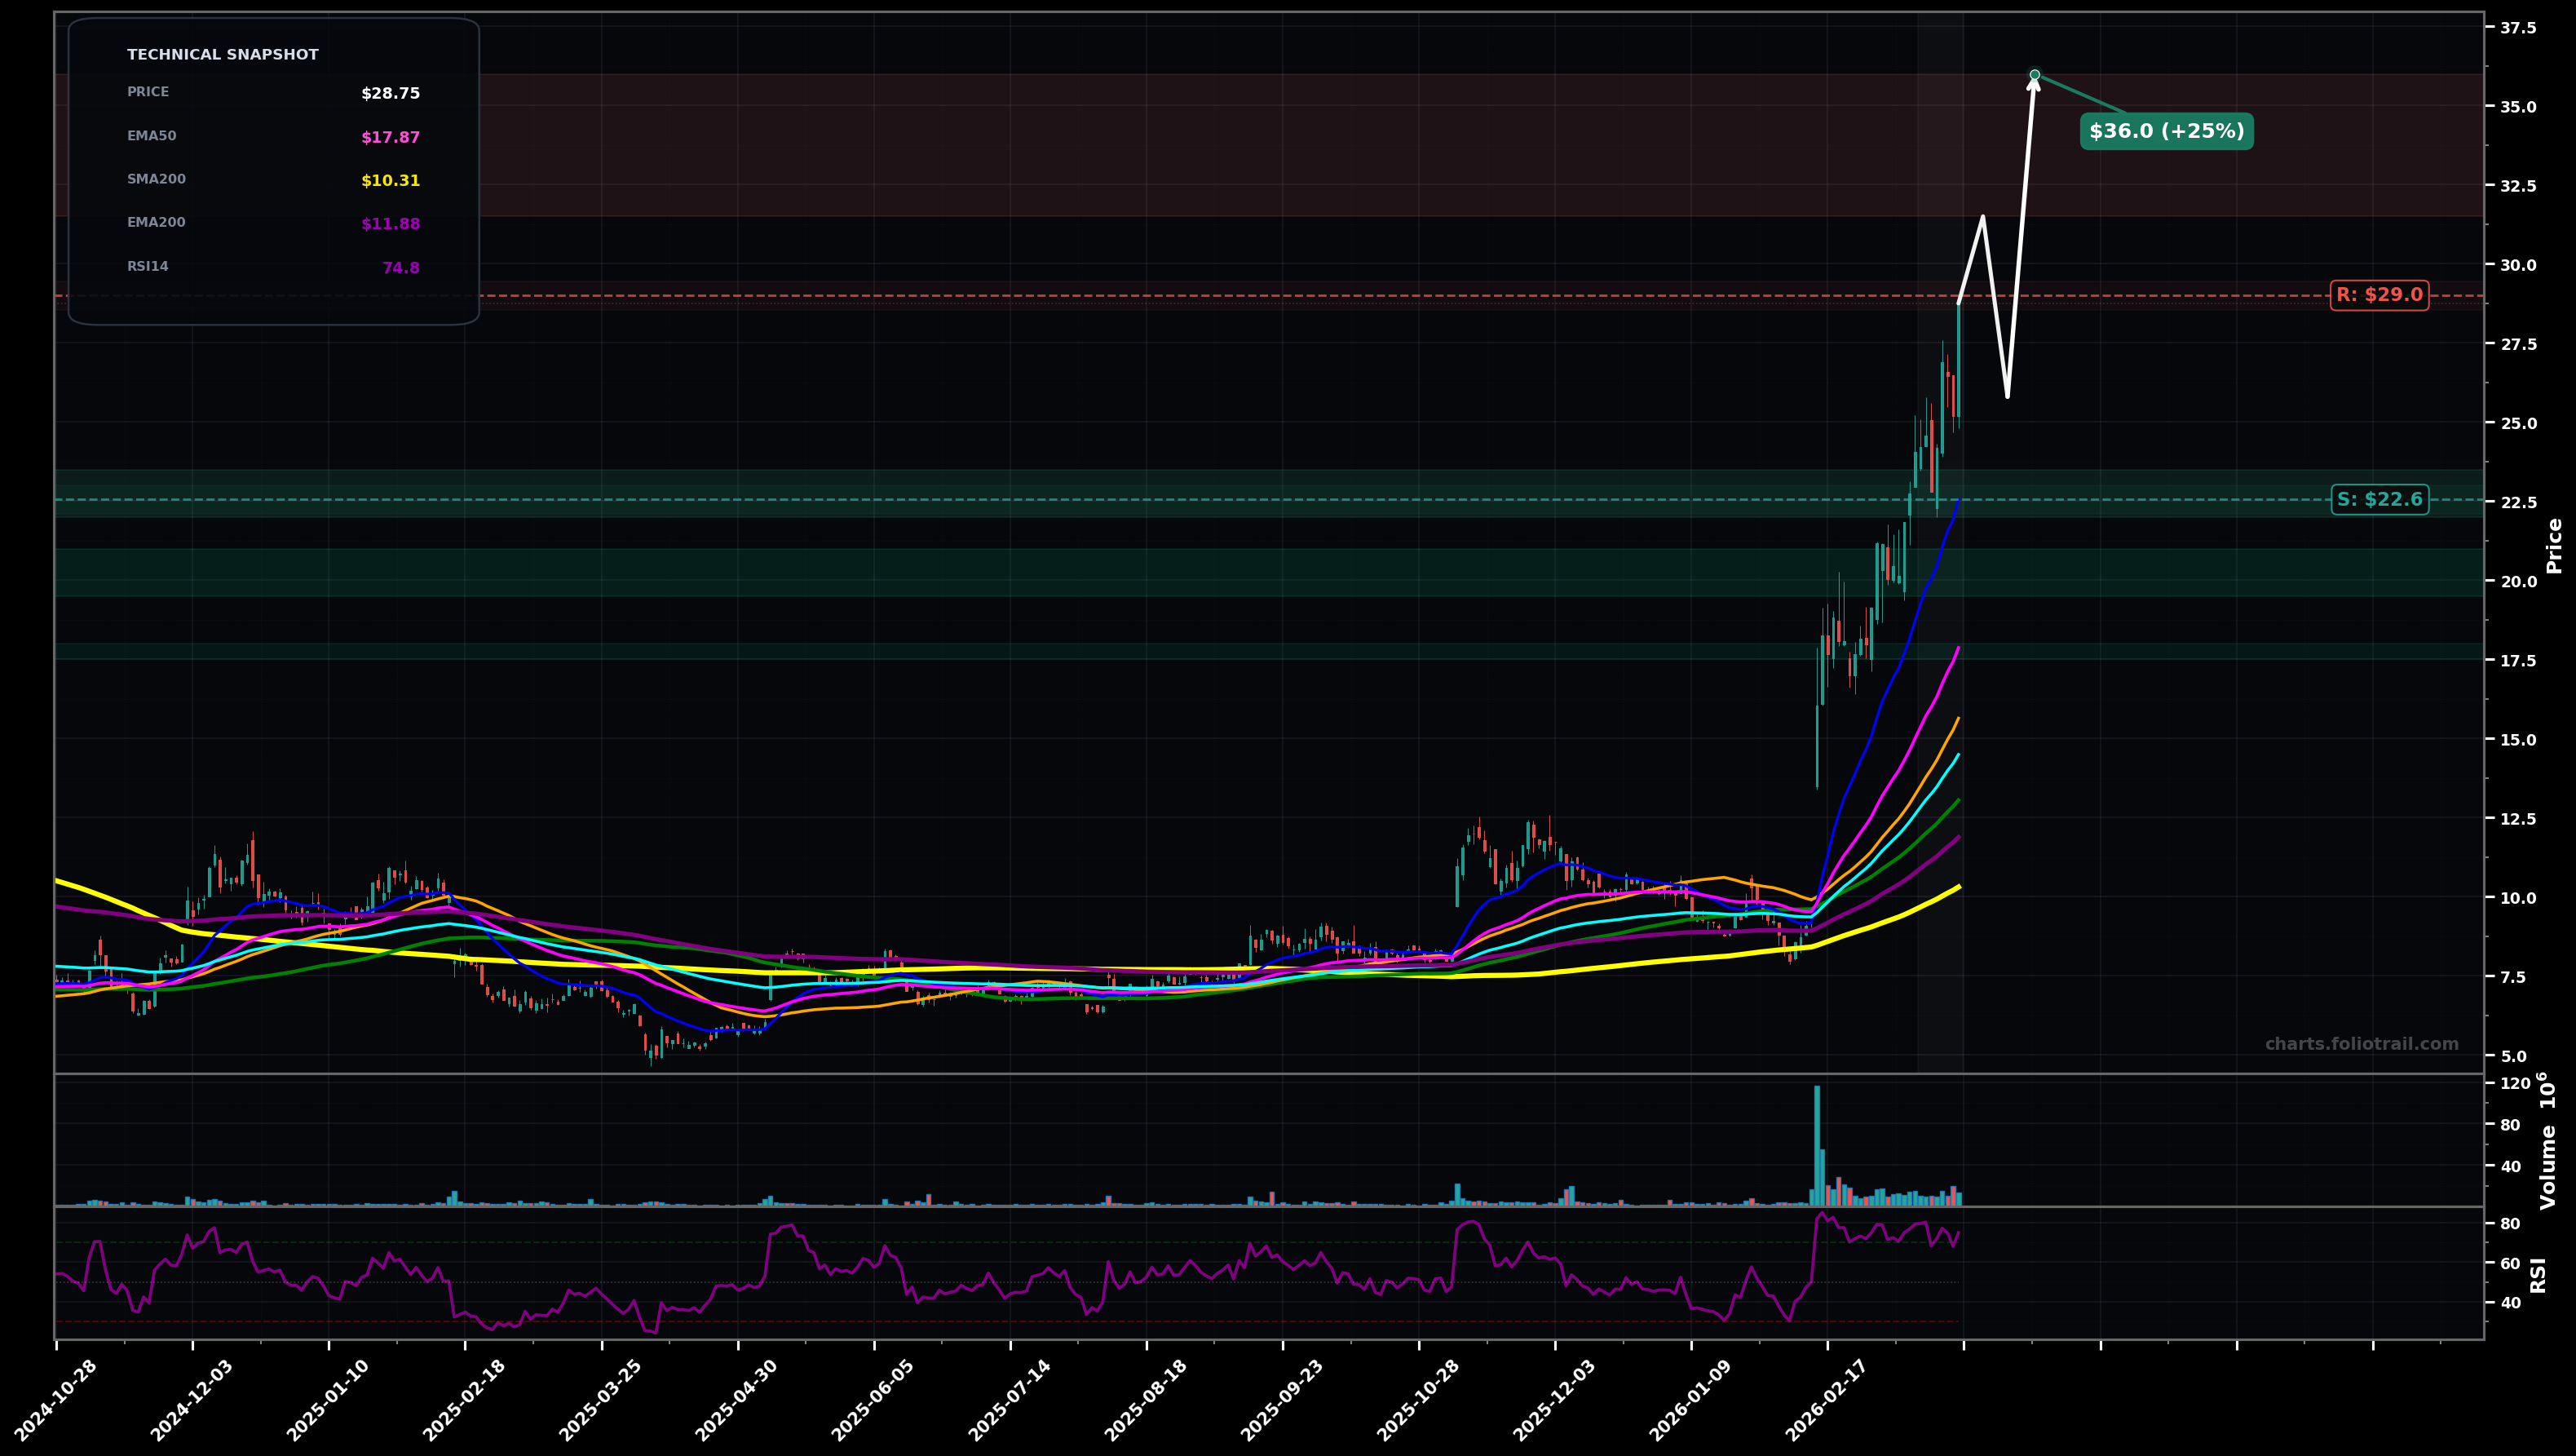
As of March 24, 2026, FSLY (Fastly Inc.) is in a parabolic state on the daily chart, with a confidence level of 78%. Key support is at $22.6 and key resistance at $29.0. Explosive breakout from long base, strong HH/HL run-up with price stretched far above rising EMA50/EMA100; RSI ~75 (overbought).
Parabolic continuation: brief consolidation/pullback that holds above EMA20, then push to a new high (likely wave 5 extension).
Mean-reversion / wave (4) style correction: momentum fades and price retraces into the rising MA cluster before resuming trend.
2+ daily closes holding above $26.00
Daily close below $22.55 (EMA20) with follow-through
Buy-the-dip zones align with EMA20 (~$22.55) then EMA50 (~$17.87) as primary trend supports; deeper add anticipates wave (4) retrace while trend remains above major MAs.
Trim into upside extensions where price is likely far above EMA50/EMA100 and sentiment/RSI stay stretched; full exit reserved for blow-off style extension well beyond prior highs.
As of March 24, 2026, FSLY (Fastly Inc.) is in a parabolic state on the daily chart with 78% confidence. Explosive breakout from long base, strong HH/HL run-up with price stretched far above rising EMA50/EMA100; RSI ~75 (overbought).
On the daily timeframe, FSLY has key support at $22.6 and key resistance at $29.0. The most likely scenario (bullish) targets $31.5 and $36.0, with a revert level at $25.8.
FSLY (Fastly Inc.) is currently classified as parabolic on the daily chart, with 78% confidence. Confirmation requires: 2+ daily closes holding above $26.00 This would be invalidated by: Daily close below $22.55 (EMA20) with follow-through
The most likely scenario (bullish) targets $31.5 and $36.0, with a revert level at $25.8. The alternative scenario (bearish) targets $21.8 and $17.9.
All content on this website — including charts, analysis, price targets, support/resistance levels, and position zones — is generated entirely by AI and provided for educational and informational purposes only.
This is not financial advice. NEXUSNOIR VENTURES SL (the operator of this website) is not a registered investment adviser or broker-dealer. You should not make investment decisions based solely on this information. Always do your own research and consult a qualified financial advisor.
By continuing, you acknowledge that you have read and agree to our full disclaimer & terms of use and privacy policy.