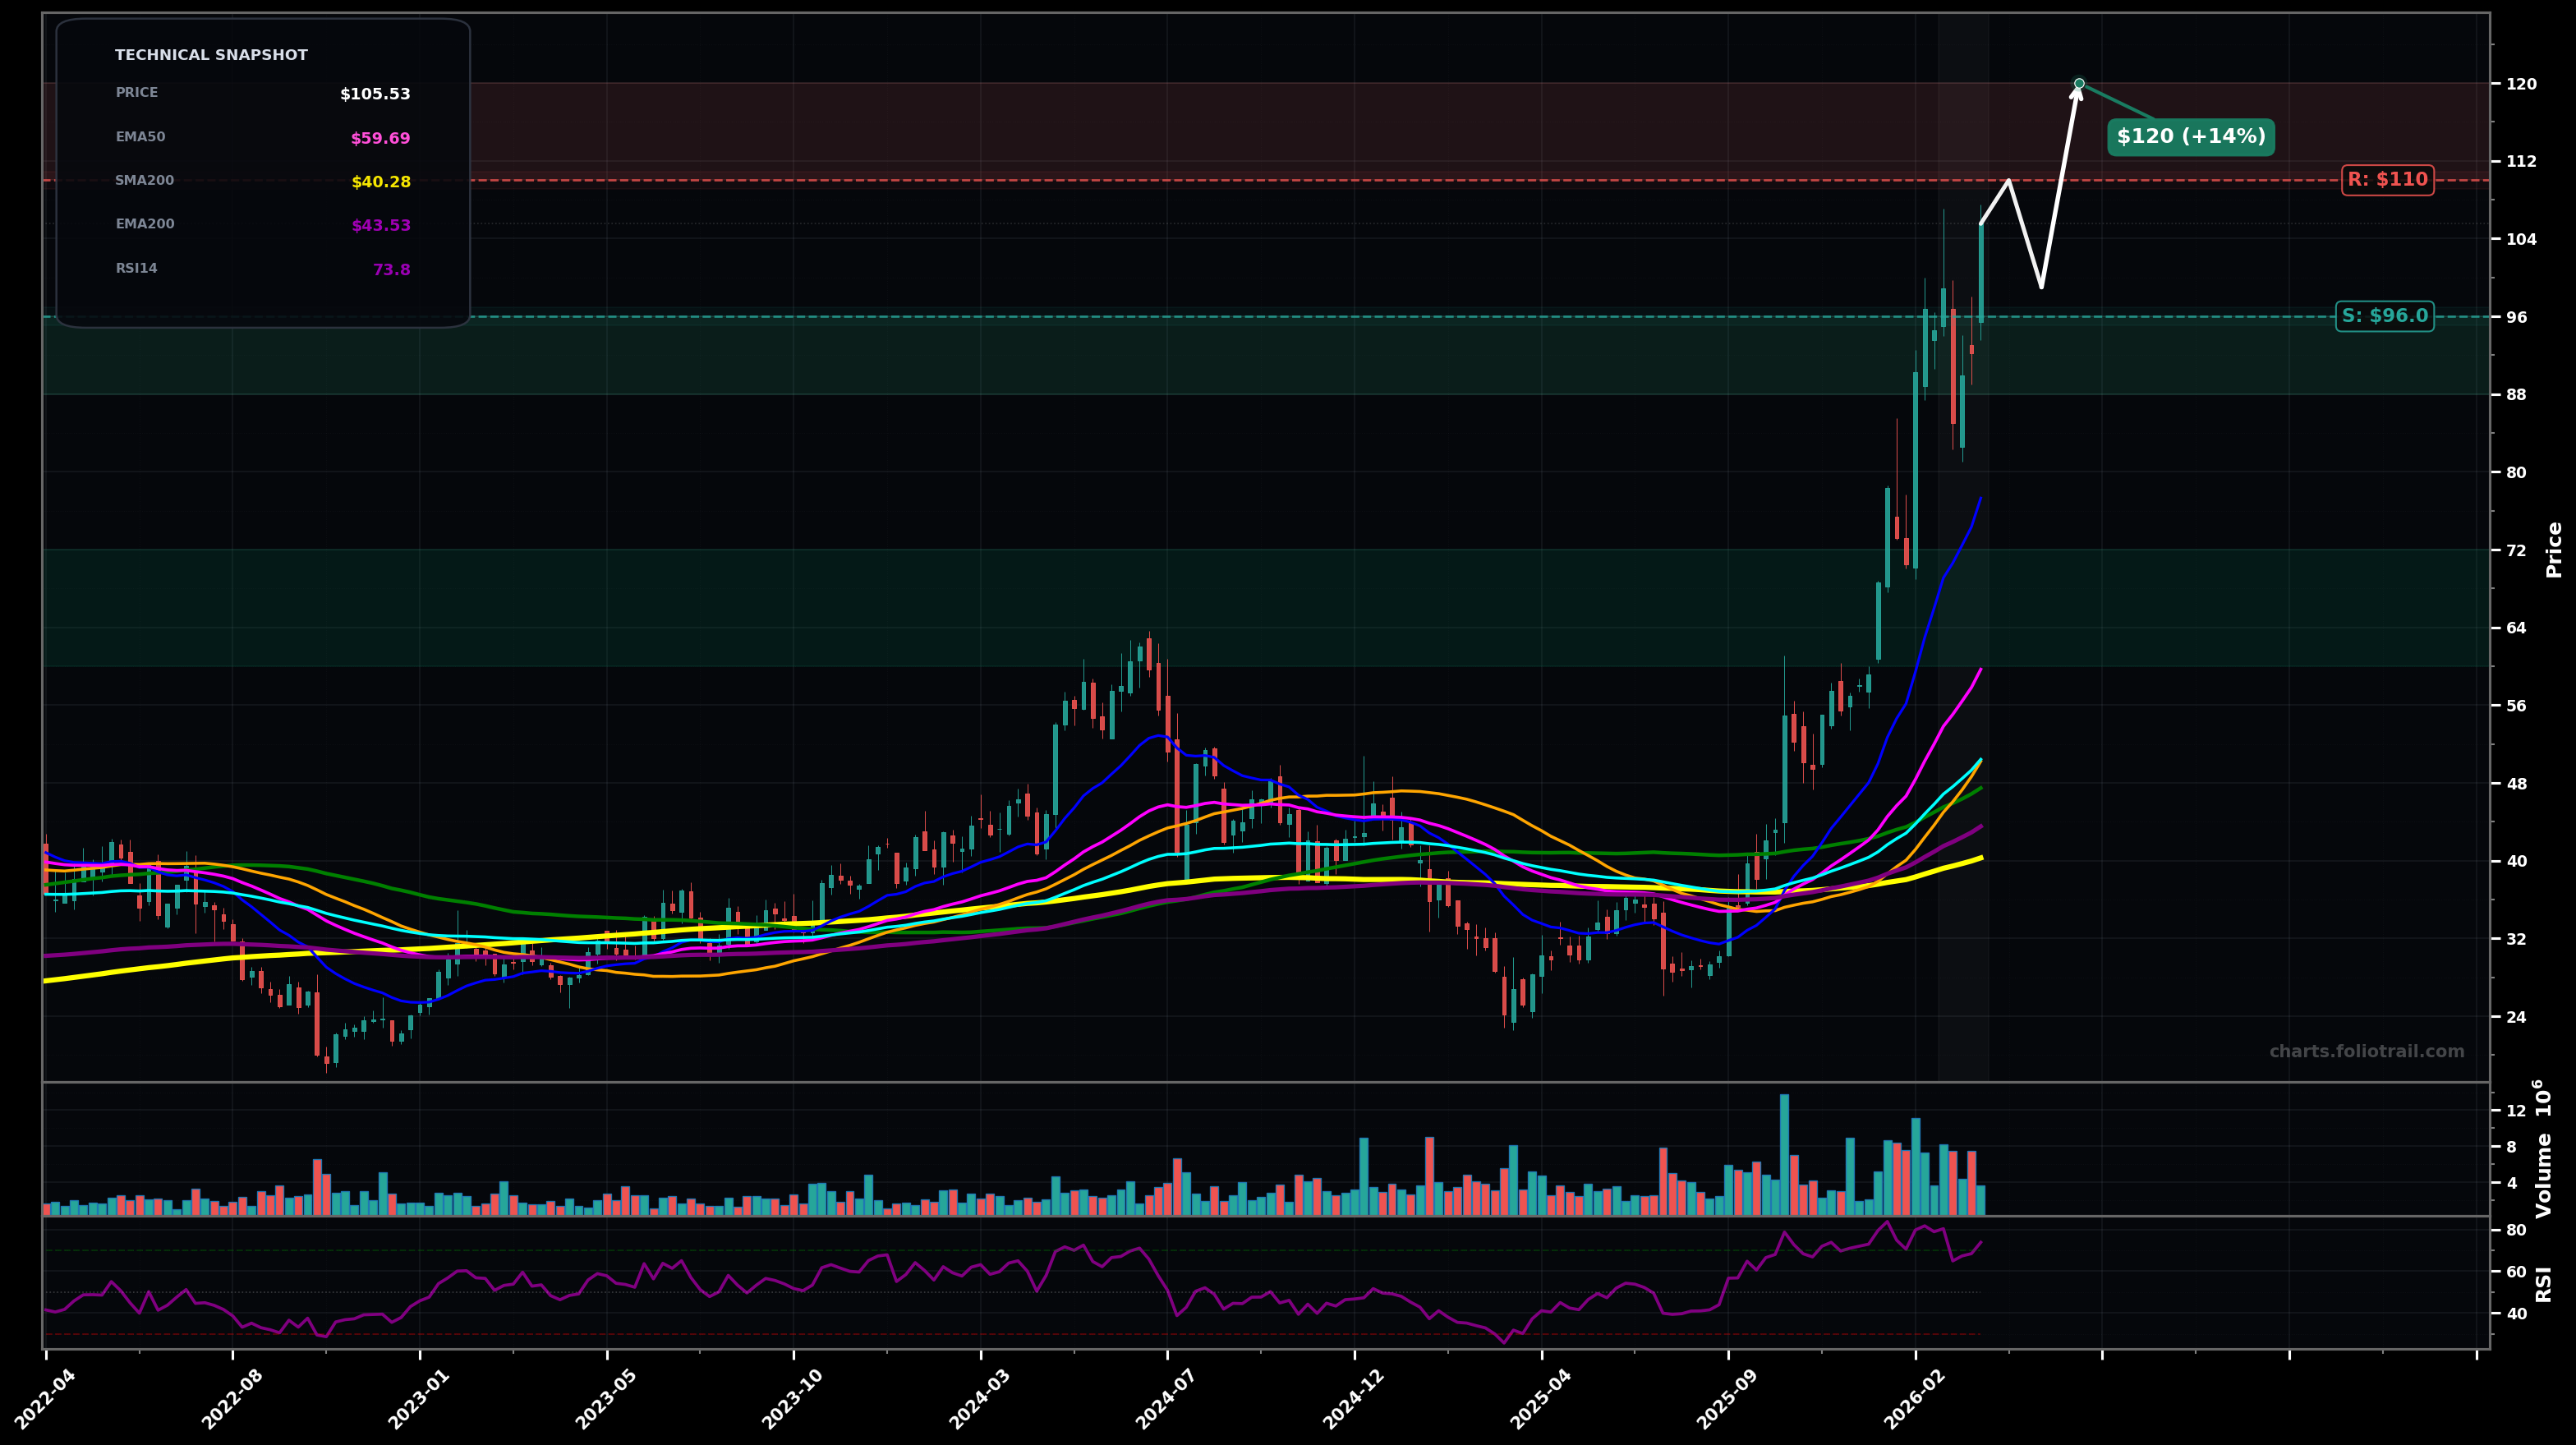
As of March 25, 2026, FORM (FormFactor Inc.) is in a parabolic state on the weekly chart, with a confidence level of 74%. Key support is at $96.0 and key resistance at $110. Strong weekly impulse to new highs with a brief pullback; price is far extended above all key EMAs/SMAs and RSI is overbought (~74).
Bullish continuation: brief consolidation/pullback holds above prior breakout area, then another leg higher (late Wave 3 or Wave 5 extension behavior); Fibonacci-style measured push targets the next round-number/extension zone.
Mean-reversion: parabolic move cools into a deeper ABC/Wave-4-type correction, first to prior breakout/swing structure, potentially down toward the rising fast/medium MAs before attempting a new base (volatility stays elevated).
Weekly close above $106.00 with follow-through toward $110.00+ (no immediate rejection wick).
Weekly close back below $96.00 (breaks the most recent swing low and signals momentum loss).
Parabolic extension suggests waiting for a Wave-4/ABC retrace: first adds at prior breakout/swing support (~$96), more at deeper structure support (~$88/$77), heavy adds only if price mean-reverts toward the rising EMA50 area (~$60s–$70s).
As price pushes further into upside extension after a parabolic run (RSI overbought and far above EMA50/100), trimming into $110–$120 then heavier trims above $120 is prudent; full exit only if a blow-off extension reaches $135+.
As of March 25, 2026, FORM (FormFactor Inc.) is in a parabolic state on the weekly chart with 74% confidence. Strong weekly impulse to new highs with a brief pullback; price is far extended above all key EMAs/SMAs and RSI is overbought (~74).
On the weekly timeframe, FORM has key support at $96.0 and key resistance at $110. The most likely scenario (bullish) targets $110 and $120, with a revert level at $99.0.
FORM (FormFactor Inc.) is currently classified as parabolic on the weekly chart, with 74% confidence. Confirmation requires: Weekly close above $106.00 with follow-through toward $110.00+ (no immediate rejection wick). This would be invalidated by: Weekly close back below $96.00 (breaks the most recent swing low and signals momentum loss).
The most likely scenario (bullish) targets $110 and $120, with a revert level at $99.0. The alternative scenario (bearish) targets $88.0 and $77.0.
Multi-layer AI agents analyse 200+ stocks across daily, weekly, and monthly timeframes — producing market state classifications, price scenarios with targets, and position entry/exit levels. Updated every trading day after market close. No paywall. No sign-up required.
Built by Foliotrail.
All content on this website — including charts, analysis, price targets, support/resistance levels, and position zones — is generated entirely by AI and provided for educational and informational purposes only.
This is not financial advice. NEXUSNOIR VENTURES SL (the operator of this website) is not a registered investment adviser or broker-dealer. You should not make investment decisions based solely on this information. Always do your own research and consult a qualified financial advisor.
By continuing, you acknowledge that you have read and agree to our full disclaimer & terms of use and privacy policy.