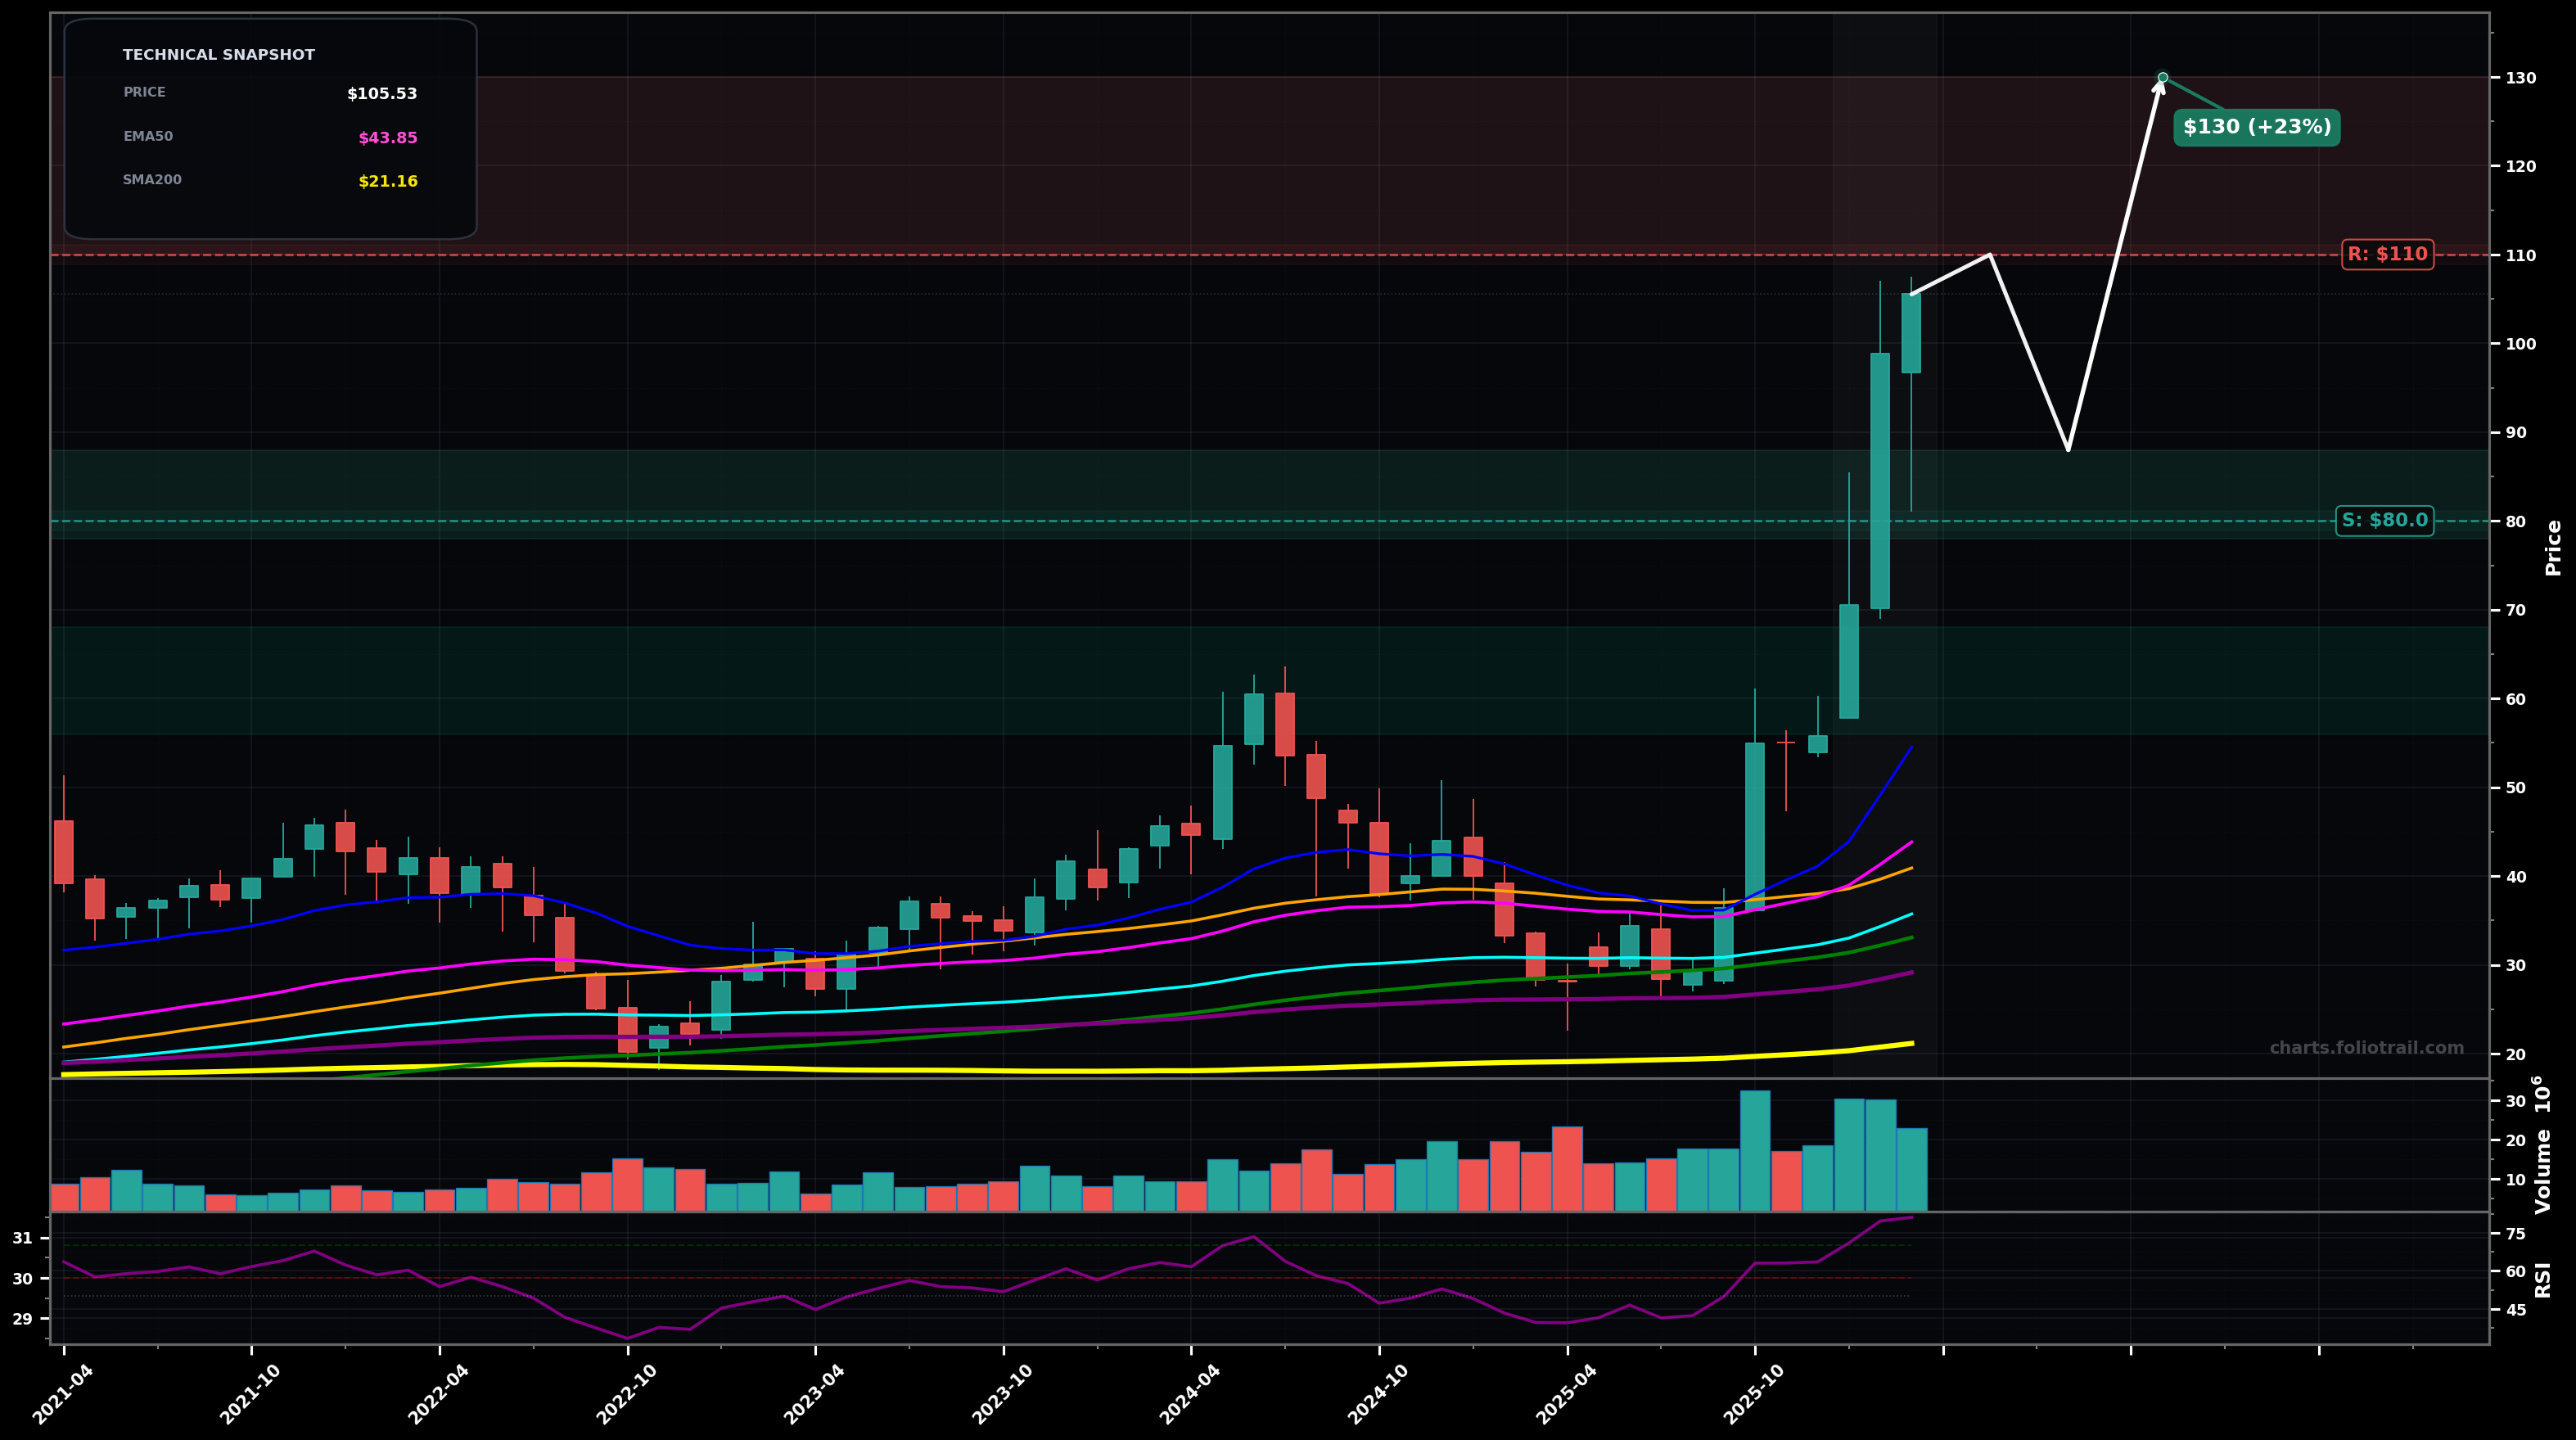
As of March 25, 2026, FORM (FormFactor Inc.) is in a parabolic state on the monthly chart, with a confidence level of 74%. Key support is at $80.0 and key resistance at $110. Strong monthly breakout from the multi-year base with consecutive wide green candles and rising volume; price is very extended above all key EMAs/SMAs and RSI is overbought (~81).
Bullish continuation but with volatility: a brief consolidation/pullback that holds above the breakout zone, then a push to a new high (Fibonacci extension behavior typical of Wave 3/5). Rough probability: 60%.
Mean-reversion after parabolic stretch: a deeper pullback toward the prior base top/fast MAs (EMA20/EMA50 zone), potentially forming a Wave 4-style correction before any attempt higher. Rough probability: 40%.
Monthly close above $105.50 followed by another higher close (hold above $100).
Monthly close back below $80 (loss of the breakout impulse and likely start of deeper mean-reversion).
Parabolic + RSI>80 favors buying pullbacks: start near breakout retest (~$80), add at deeper Fib retrace, heavy add near EMA50/EMA100 confluence and prior swing structure.
Trim into extension zones (likely Wave 5/extension) as price becomes increasingly detached from EMA50/EMA100; close if blow-off valuations/price extensions persist into upper Fib-extension territory.
As of March 25, 2026, FORM (FormFactor Inc.) is in a parabolic state on the monthly chart with 74% confidence. Strong monthly breakout from the multi-year base with consecutive wide green candles and rising volume; price is very extended above all key EMAs/SMAs and RSI is overbought (~81).
On the monthly timeframe, FORM has key support at $80.0 and key resistance at $110. The most likely scenario (bullish) targets $110 and $130, with a revert level at $88.0.
FORM (FormFactor Inc.) is currently classified as parabolic on the monthly chart, with 74% confidence. Confirmation requires: Monthly close above $105.50 followed by another higher close (hold above $100). This would be invalidated by: Monthly close back below $80 (loss of the breakout impulse and likely start of deeper mean-reversion).
The most likely scenario (bullish) targets $110 and $130, with a revert level at $88.0. The alternative scenario (bearish) targets $88.0 and $70.0.
Multi-layer AI agents analyse 200+ stocks across daily, weekly, and monthly timeframes — producing market state classifications, price scenarios with targets, and position entry/exit levels. Updated every trading day after market close. No paywall. No sign-up required.
Built by Foliotrail.
All content on this website — including charts, analysis, price targets, support/resistance levels, and position zones — is generated entirely by AI and provided for educational and informational purposes only.
This is not financial advice. NEXUSNOIR VENTURES SL (the operator of this website) is not a registered investment adviser or broker-dealer. You should not make investment decisions based solely on this information. Always do your own research and consult a qualified financial advisor.
By continuing, you acknowledge that you have read and agree to our full disclaimer & terms of use and privacy policy.