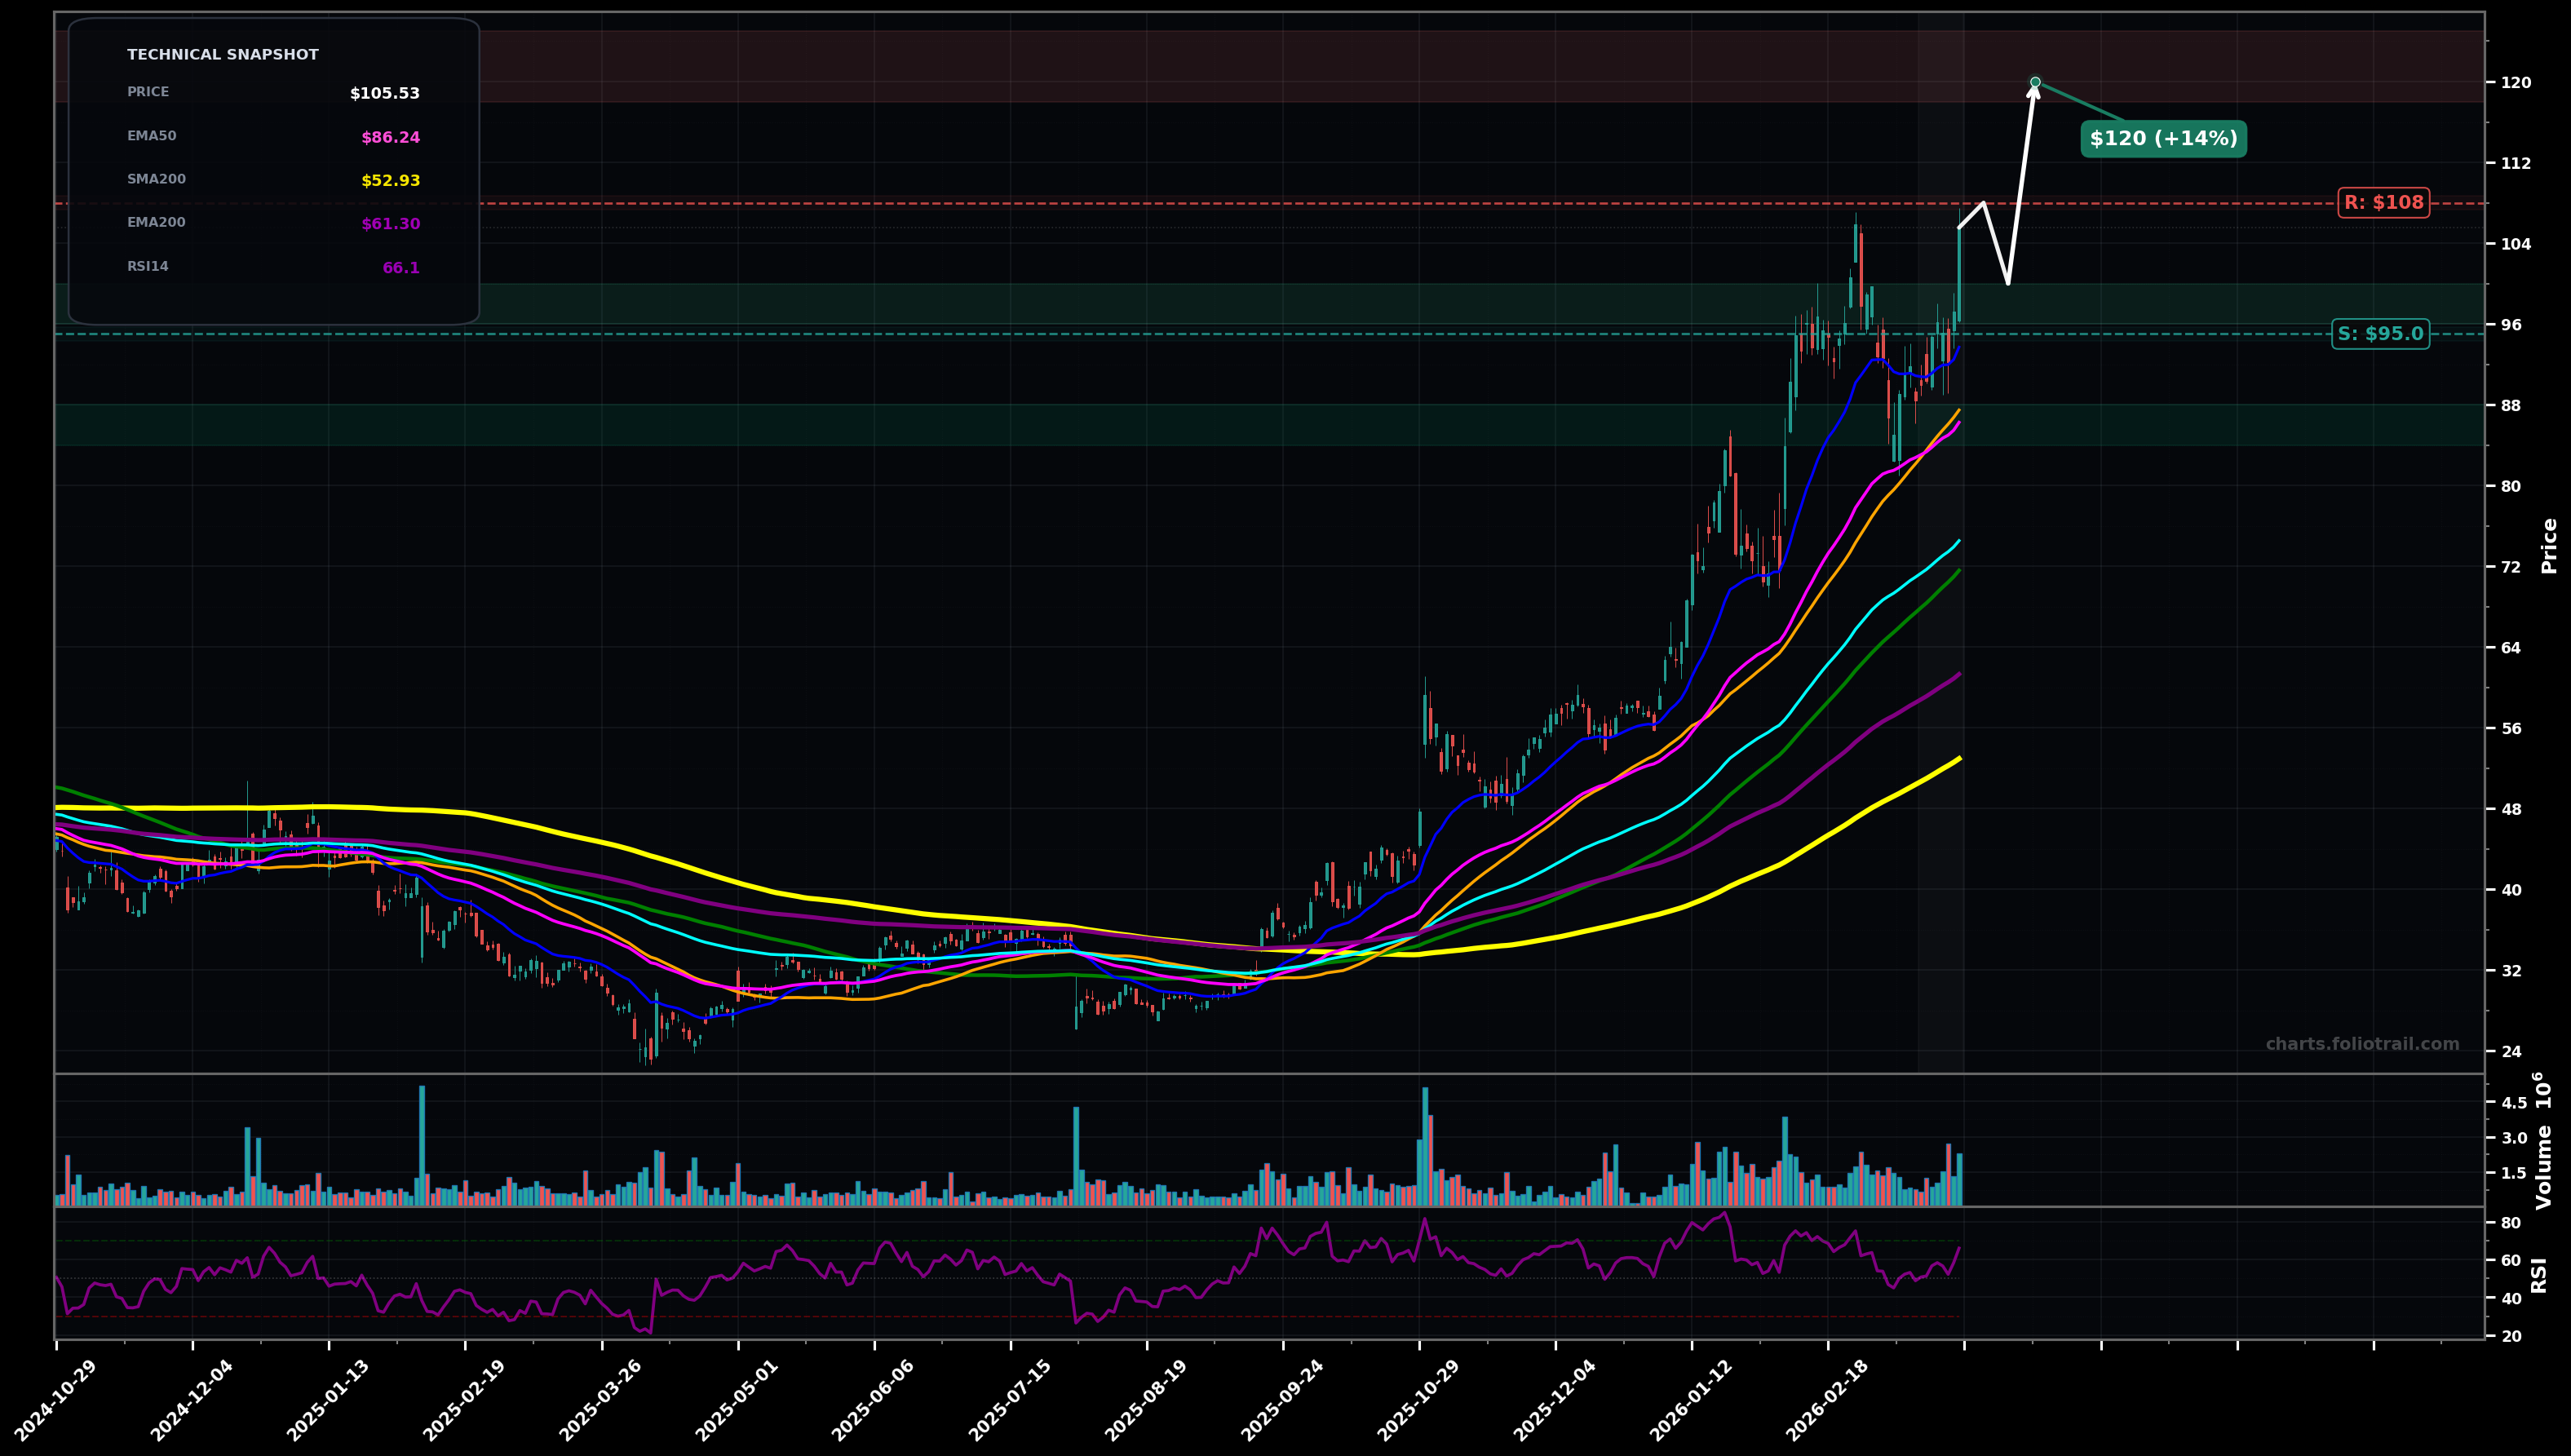
As of March 25, 2026, FORM (FormFactor Inc.) is in a uptrend state on the daily chart, with a confidence level of 78%. Key support is at $95.0 and key resistance at $108. Price at ~$105.53 pushed back to the prior highs after a sharp pullback, holding well above rising EMA50/EMA100; RSI ~66 suggests strong momentum but not extreme.
Bullish continuation: consolidation above ~$95–$100 then breakout to new highs (impulsive Elliott Wave extension; likely wave 5 or a wave 3 extension if the pullback was wave 4).
Bearish deeper retrace: rejection near ~$108 leads to a pullback toward the rising trend MAs (Fibonacci-style retrace of the latest upswing), but trend remains intact unless EMA50 breaks.
2+ daily closes holding above $100.00 followed by a break/close above $108.00
Daily close below $86.00 (loss of EMA50 + prior swing support)
Buy-the-dip aligned to prior breakout zone ~$95–$100, then deeper adds into likely Fib retrace + rising EMA50 (~$86) confluence if volatility expands.
Trim into upside extensions beyond prior ATH ($108) where price is likely stretched vs EMA50/EMA100; progressively heavier trims at larger Fibonacci/Elliott extension zones.
As of March 25, 2026, FORM (FormFactor Inc.) is in a uptrend state on the daily chart with 78% confidence. Price at ~$105.53 pushed back to the prior highs after a sharp pullback, holding well above rising EMA50/EMA100; RSI ~66 suggests strong momentum but not extreme.
On the daily timeframe, FORM has key support at $95.0 and key resistance at $108. The most likely scenario (bullish) targets $108 and $120, with a revert level at $100.
FORM (FormFactor Inc.) is currently classified as uptrend on the daily chart, with 78% confidence. Confirmation requires: 2+ daily closes holding above $100.00 followed by a break/close above $108.00 This would be invalidated by: Daily close below $86.00 (loss of EMA50 + prior swing support)
The most likely scenario (bullish) targets $108 and $120, with a revert level at $100. The alternative scenario (bearish) targets $90.0 and $86.0.
Multi-layer AI agents analyse 200+ stocks across daily, weekly, and monthly timeframes — producing market state classifications, price scenarios with targets, and position entry/exit levels. Updated every trading day after market close. No paywall. No sign-up required.
Built by Foliotrail.
All content on this website — including charts, analysis, price targets, support/resistance levels, and position zones — is generated entirely by AI and provided for educational and informational purposes only.
This is not financial advice. NEXUSNOIR VENTURES SL (the operator of this website) is not a registered investment adviser or broker-dealer. You should not make investment decisions based solely on this information. Always do your own research and consult a qualified financial advisor.
By continuing, you acknowledge that you have read and agree to our full disclaimer & terms of use and privacy policy.