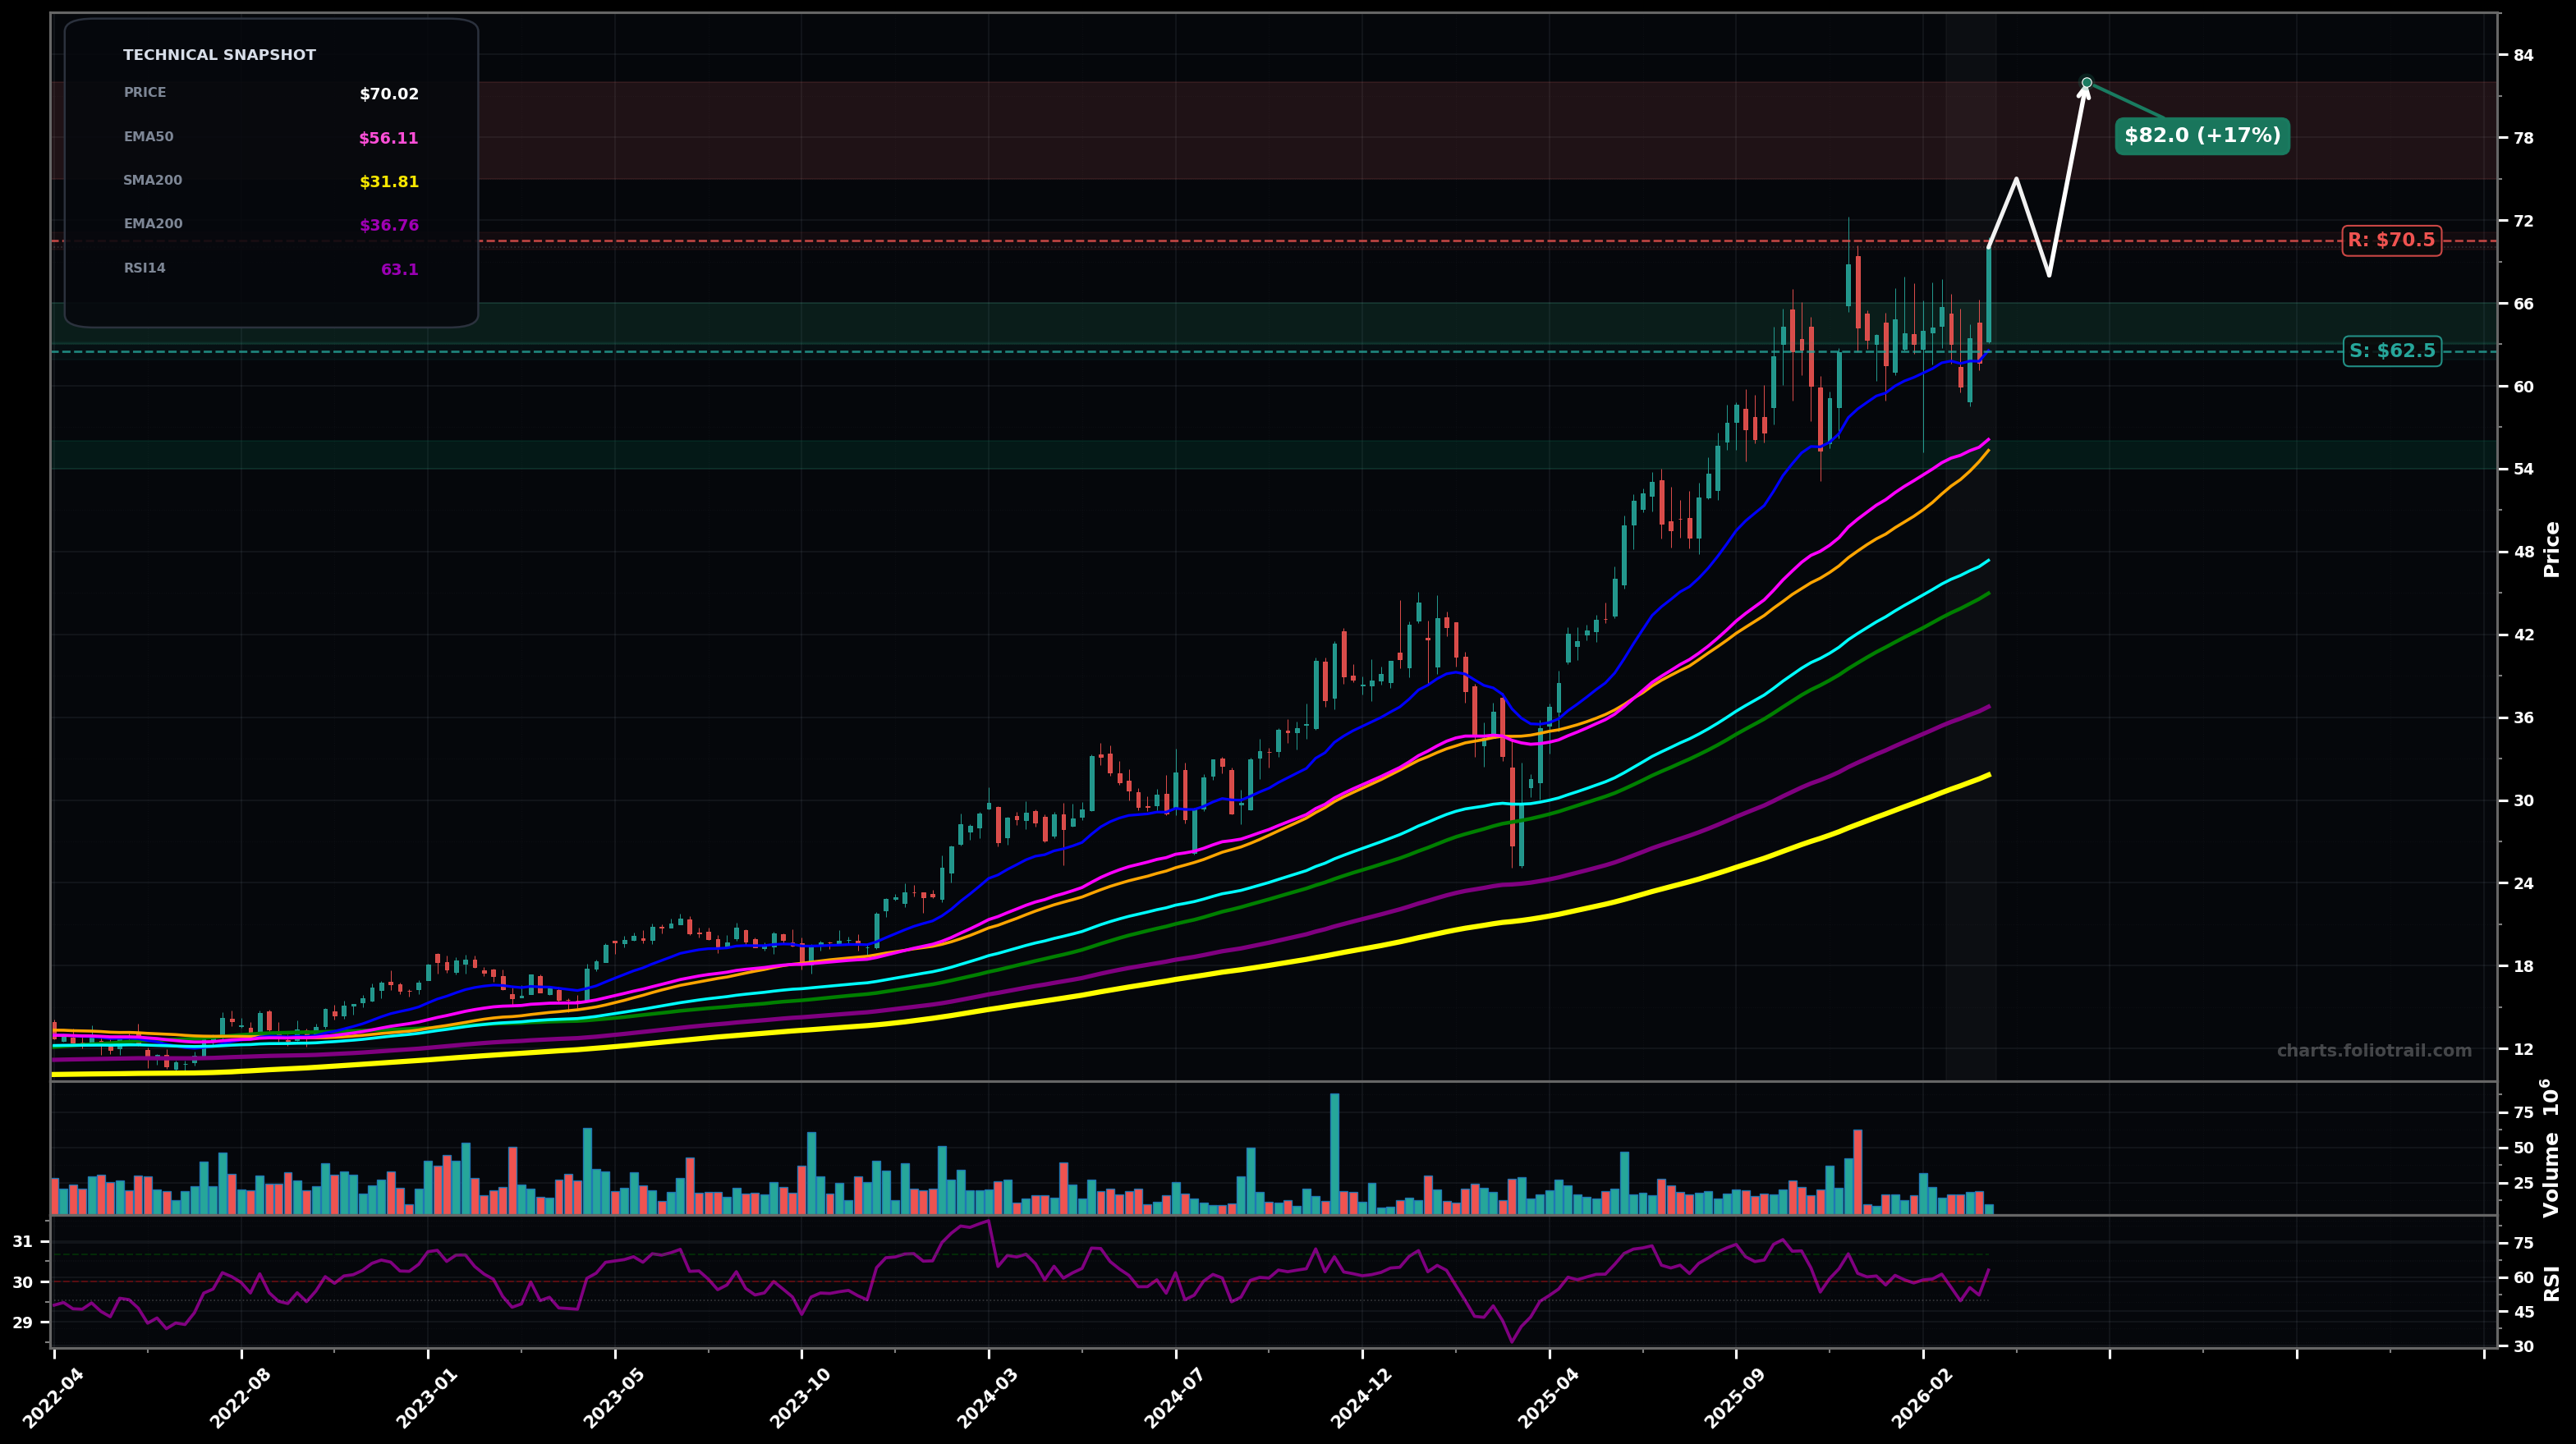
As of March 26, 2026, FLEX (Flex Ltd.) is in a uptrend state on the weekly chart, with a confidence level of 72%. Key support is at $62.5 and key resistance at $70.5. Price is consolidating just below recent highs around $70 after a strong multi-month advance; candles are overlapping but trend structure remains intact above rising EMAs.
Bullish continuation: range resolves upward; a break/hold above the $70 area triggers the next impulsive leg (Elliott: likely wave 5 extension after a wave-4 style consolidation).
Bearish pullback within uptrend: failure to hold $70 leads to a deeper wave-4 style retrace toward the rising EMA50 zone before buyers attempt another push.
Weekly close above $70.50 with follow-through holding above $70
Weekly close below $62.50 (loss of EMA20/near-term trend support)
Start near prior breakout/EMA20-50 confluence; add on deeper pullback to EMA50 (pink) and prior swing support; heavy add near stronger MA cluster (SMA50/EMA100 area) if trend remains intact.
Trim into upside extension beyond the recent range high; increase trimming if price accelerates away from EMA50 with RSI staying elevated; close if a multi-year-style overextension occurs well above long MAs (EMA200/SMA200).
As of March 26, 2026, FLEX (Flex Ltd.) is in a uptrend state on the weekly chart with 72% confidence. Price is consolidating just below recent highs around $70 after a strong multi-month advance; candles are overlapping but trend structure remains intact above rising EMAs.
On the weekly timeframe, FLEX has key support at $62.5 and key resistance at $70.5. The most likely scenario (bullish) targets $75.0 and $82.0, with a revert level at $68.0.
FLEX (Flex Ltd.) is currently classified as uptrend on the weekly chart, with 72% confidence. Confirmation requires: Weekly close above $70.50 with follow-through holding above $70 This would be invalidated by: Weekly close below $62.50 (loss of EMA20/near-term trend support)
The most likely scenario (bullish) targets $75.0 and $82.0, with a revert level at $68.0. The alternative scenario (bearish) targets $62.5 and $56.0.
Multi-layer AI agents analyse 200+ stocks across daily, weekly, and monthly timeframes — producing market state classifications, price scenarios with targets, and position entry/exit levels. Updated every trading day after market close. No paywall. No sign-up required.
Built by Foliotrail.
All content on this website — including charts, analysis, price targets, support/resistance levels, and position zones — is generated entirely by AI and provided for educational and informational purposes only.
This is not financial advice. NEXUSNOIR VENTURES SL (the operator of this website) is not a registered investment adviser or broker-dealer. You should not make investment decisions based solely on this information. Always do your own research and consult a qualified financial advisor.
By continuing, you acknowledge that you have read and agree to our full disclaimer & terms of use and privacy policy.