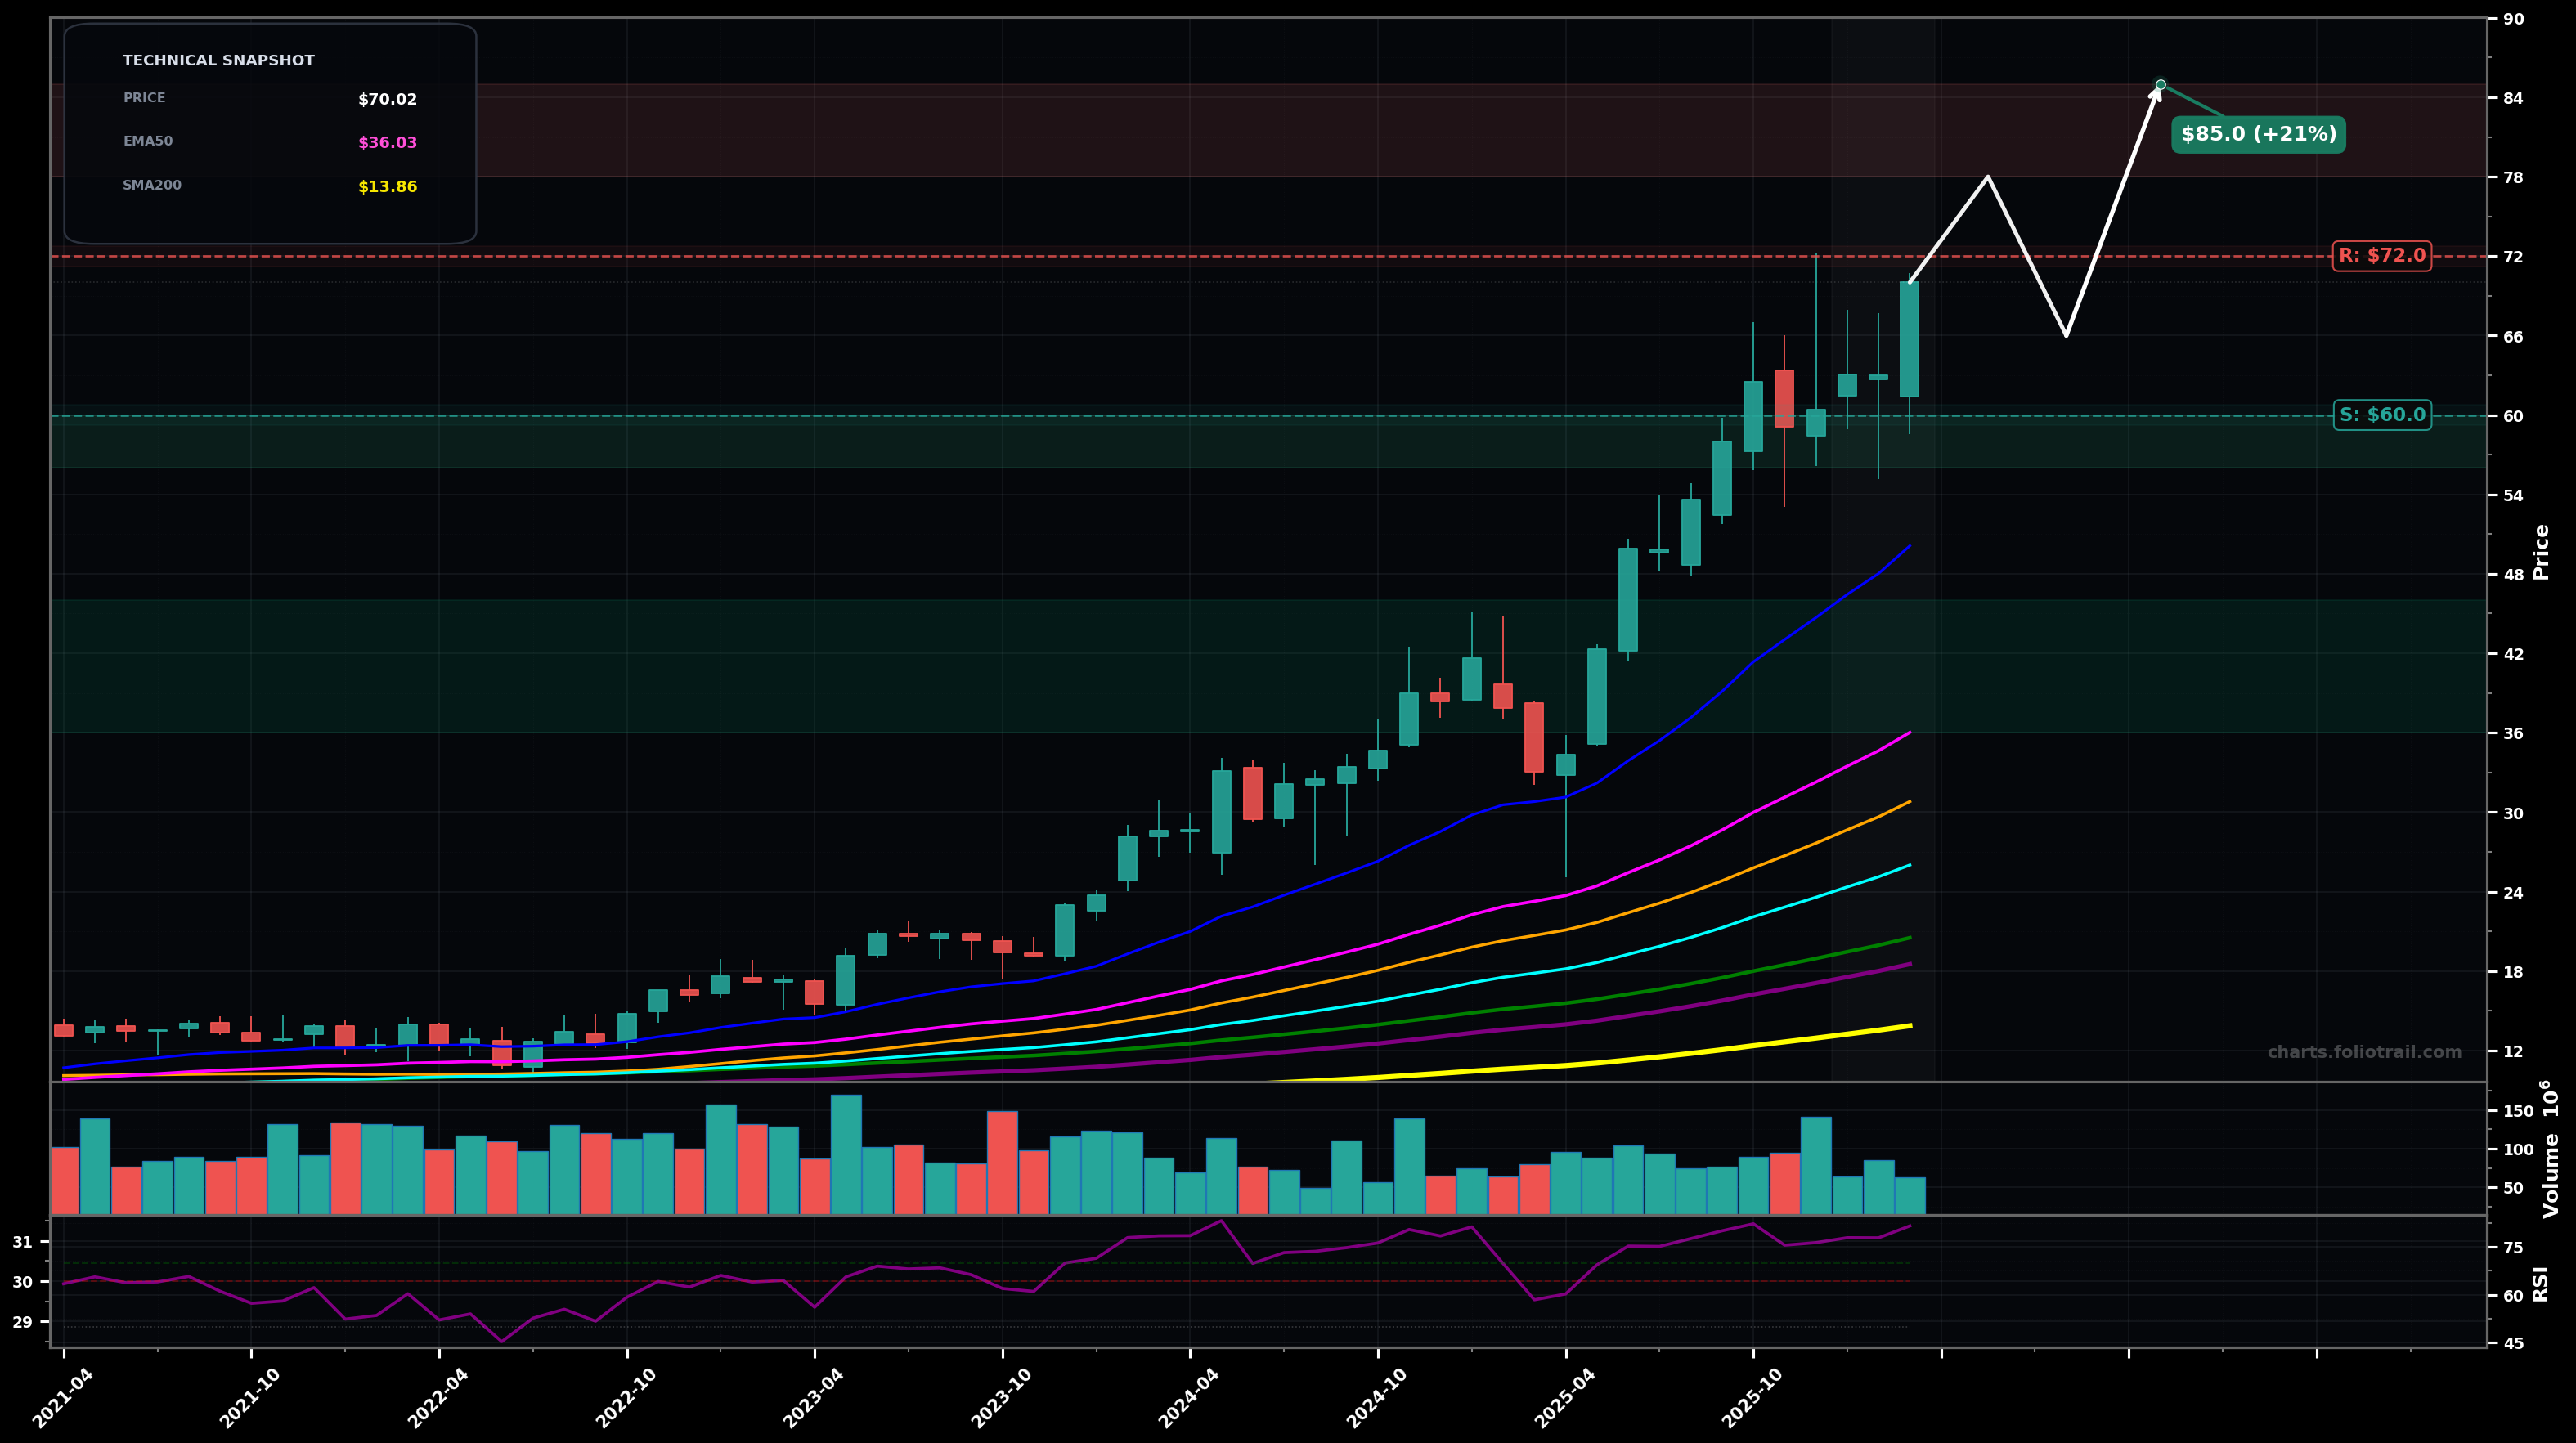
As of March 26, 2026, FLEX (Flex Ltd.) is in a parabolic state on the monthly chart, with a confidence level of 72%. Key support is at $60.0 and key resistance at $72.0. Strong HH/HL advance; price at ~$70.02 pressing new highs with momentum (RSI-14 ~81.6) and a brief consolidation near highs.
Bullish continuation as a late-stage Elliott impulse (wave 5 extension) with only shallow pullbacks; price grinds higher while staying above the $60 area.
Mean-reversion / wave-4 style monthly pullback after RSI extreme: drop toward the prior breakout/swing zone, then attempt a higher low and resume uptrend.
Monthly close above $70.00 followed by another close holding >$70.00
Monthly close below $60.00 (break of the most recent swing-low area / loss of steep trend)
Buy-the-dip zones align with prior swing structure and likely fib retrace band of the last impulse (~0.236 to 0.382 first, then ~0.5), with EMA50 (pink) rising below as dynamic support.
Price is already far extended above EMA50/100/200; trimming bands assume further impulse extension (fib projections) where upside becomes increasingly asymmetric and a larger multi-month retrace risk rises.
As of March 26, 2026, FLEX (Flex Ltd.) is in a parabolic state on the monthly chart with 72% confidence. Strong HH/HL advance; price at ~$70.02 pressing new highs with momentum (RSI-14 ~81.6) and a brief consolidation near highs.
On the monthly timeframe, FLEX has key support at $60.0 and key resistance at $72.0. The most likely scenario (bullish) targets $78.0 and $85.0, with a revert level at $66.0.
FLEX (Flex Ltd.) is currently classified as parabolic on the monthly chart, with 72% confidence. Confirmation requires: Monthly close above $70.00 followed by another close holding >$70.00 This would be invalidated by: Monthly close below $60.00 (break of the most recent swing-low area / loss of steep trend)
The most likely scenario (bullish) targets $78.0 and $85.0, with a revert level at $66.0. The alternative scenario (bearish) targets $55.0 and $46.0.
Multi-layer AI agents analyse 200+ stocks across daily, weekly, and monthly timeframes — producing market state classifications, price scenarios with targets, and position entry/exit levels. Updated every trading day after market close. No paywall. No sign-up required.
Built by Foliotrail.
All content on this website — including charts, analysis, price targets, support/resistance levels, and position zones — is generated entirely by AI and provided for educational and informational purposes only.
This is not financial advice. NEXUSNOIR VENTURES SL (the operator of this website) is not a registered investment adviser or broker-dealer. You should not make investment decisions based solely on this information. Always do your own research and consult a qualified financial advisor.
By continuing, you acknowledge that you have read and agree to our full disclaimer & terms of use and privacy policy.