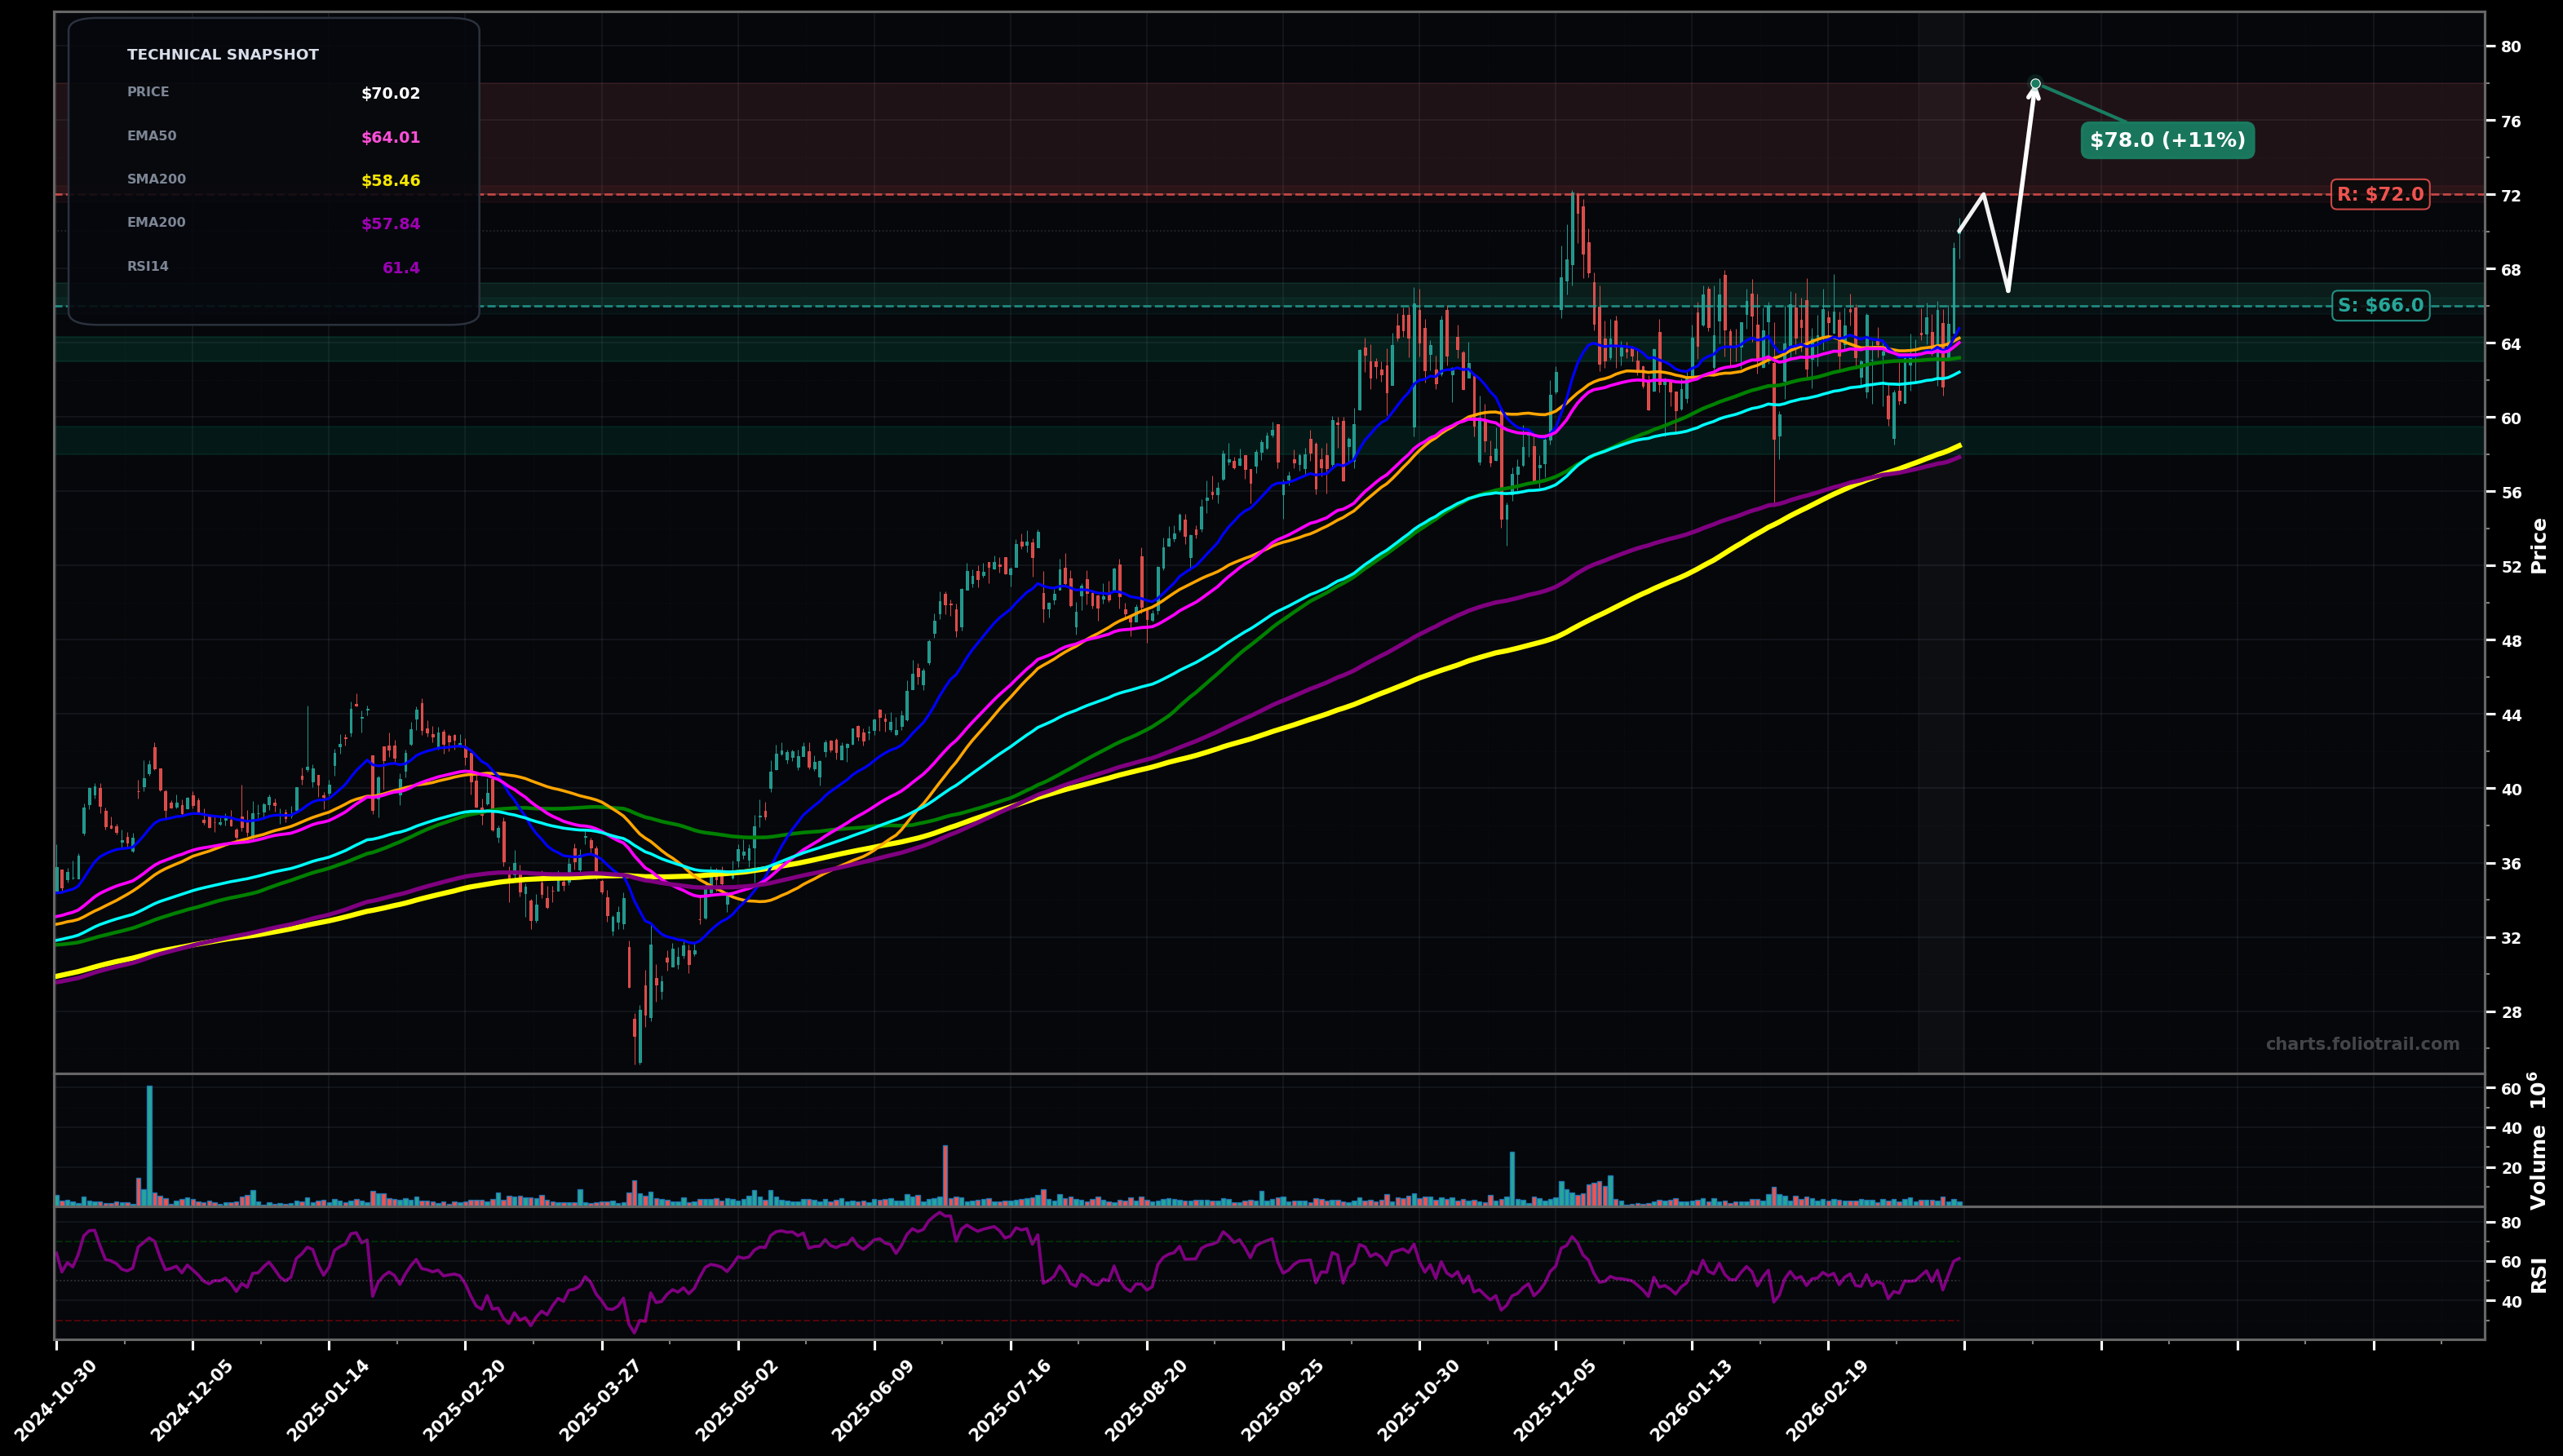
As of March 26, 2026, FLEX (Flex Ltd.) is in a uptrend state on the daily chart, with a confidence level of 72%. Key support is at $66.0 and key resistance at $72.0. Price broke out of a multi-month $60–$66 range and pushed to ~$70; now extended above clustered short/mid MAs with RSI ~61.
Bullish continuation: brief pullback/flag into the breakout area ($66–$67) then push toward the prior high zone and a measured-move extension.
Failed breakout / deeper retrace: price rejects near $72 and mean-reverts to the EMA cluster; if momentum fades, a test of the $62–$63 region follows.
Daily close holding above $66.50 for 2+ sessions (prior range top) confirms trend continuation.
Daily close below $62.40 (≈ EMA100/swing-low area) shifts structure to a failed breakout risk.
Start on breakout retest ($66–$67); add on EMA50/100 confluence ($63–$64); heavy add near EMA200/SMA200 area (~$58) if a deeper flush occurs while long-term trend remains intact.
Trim into resistance/extension zones (prior high then measured-move/Fib extensions); progressively reduce as price gets increasingly stretched above long-term MAs (EMA200/SMA200).
As of March 26, 2026, FLEX (Flex Ltd.) is in a uptrend state on the daily chart with 72% confidence. Price broke out of a multi-month $60–$66 range and pushed to ~$70; now extended above clustered short/mid MAs with RSI ~61.
On the daily timeframe, FLEX has key support at $66.0 and key resistance at $72.0. The most likely scenario (bullish) targets $72.0 and $78.0, with a revert level at $66.8.
FLEX (Flex Ltd.) is currently classified as uptrend on the daily chart, with 72% confidence. Confirmation requires: Daily close holding above $66.50 for 2+ sessions (prior range top) confirms trend continuation. This would be invalidated by: Daily close below $62.40 (≈ EMA100/swing-low area) shifts structure to a failed breakout risk.
The most likely scenario (bullish) targets $72.0 and $78.0, with a revert level at $66.8. The alternative scenario (bearish) targets $63.2 and $58.5.
Multi-layer AI agents analyse 200+ stocks across daily, weekly, and monthly timeframes — producing market state classifications, price scenarios with targets, and position entry/exit levels. Updated every trading day after market close. No paywall. No sign-up required.
Built by Foliotrail.
All content on this website — including charts, analysis, price targets, support/resistance levels, and position zones — is generated entirely by AI and provided for educational and informational purposes only.
This is not financial advice. NEXUSNOIR VENTURES SL (the operator of this website) is not a registered investment adviser or broker-dealer. You should not make investment decisions based solely on this information. Always do your own research and consult a qualified financial advisor.
By continuing, you acknowledge that you have read and agree to our full disclaimer & terms of use and privacy policy.