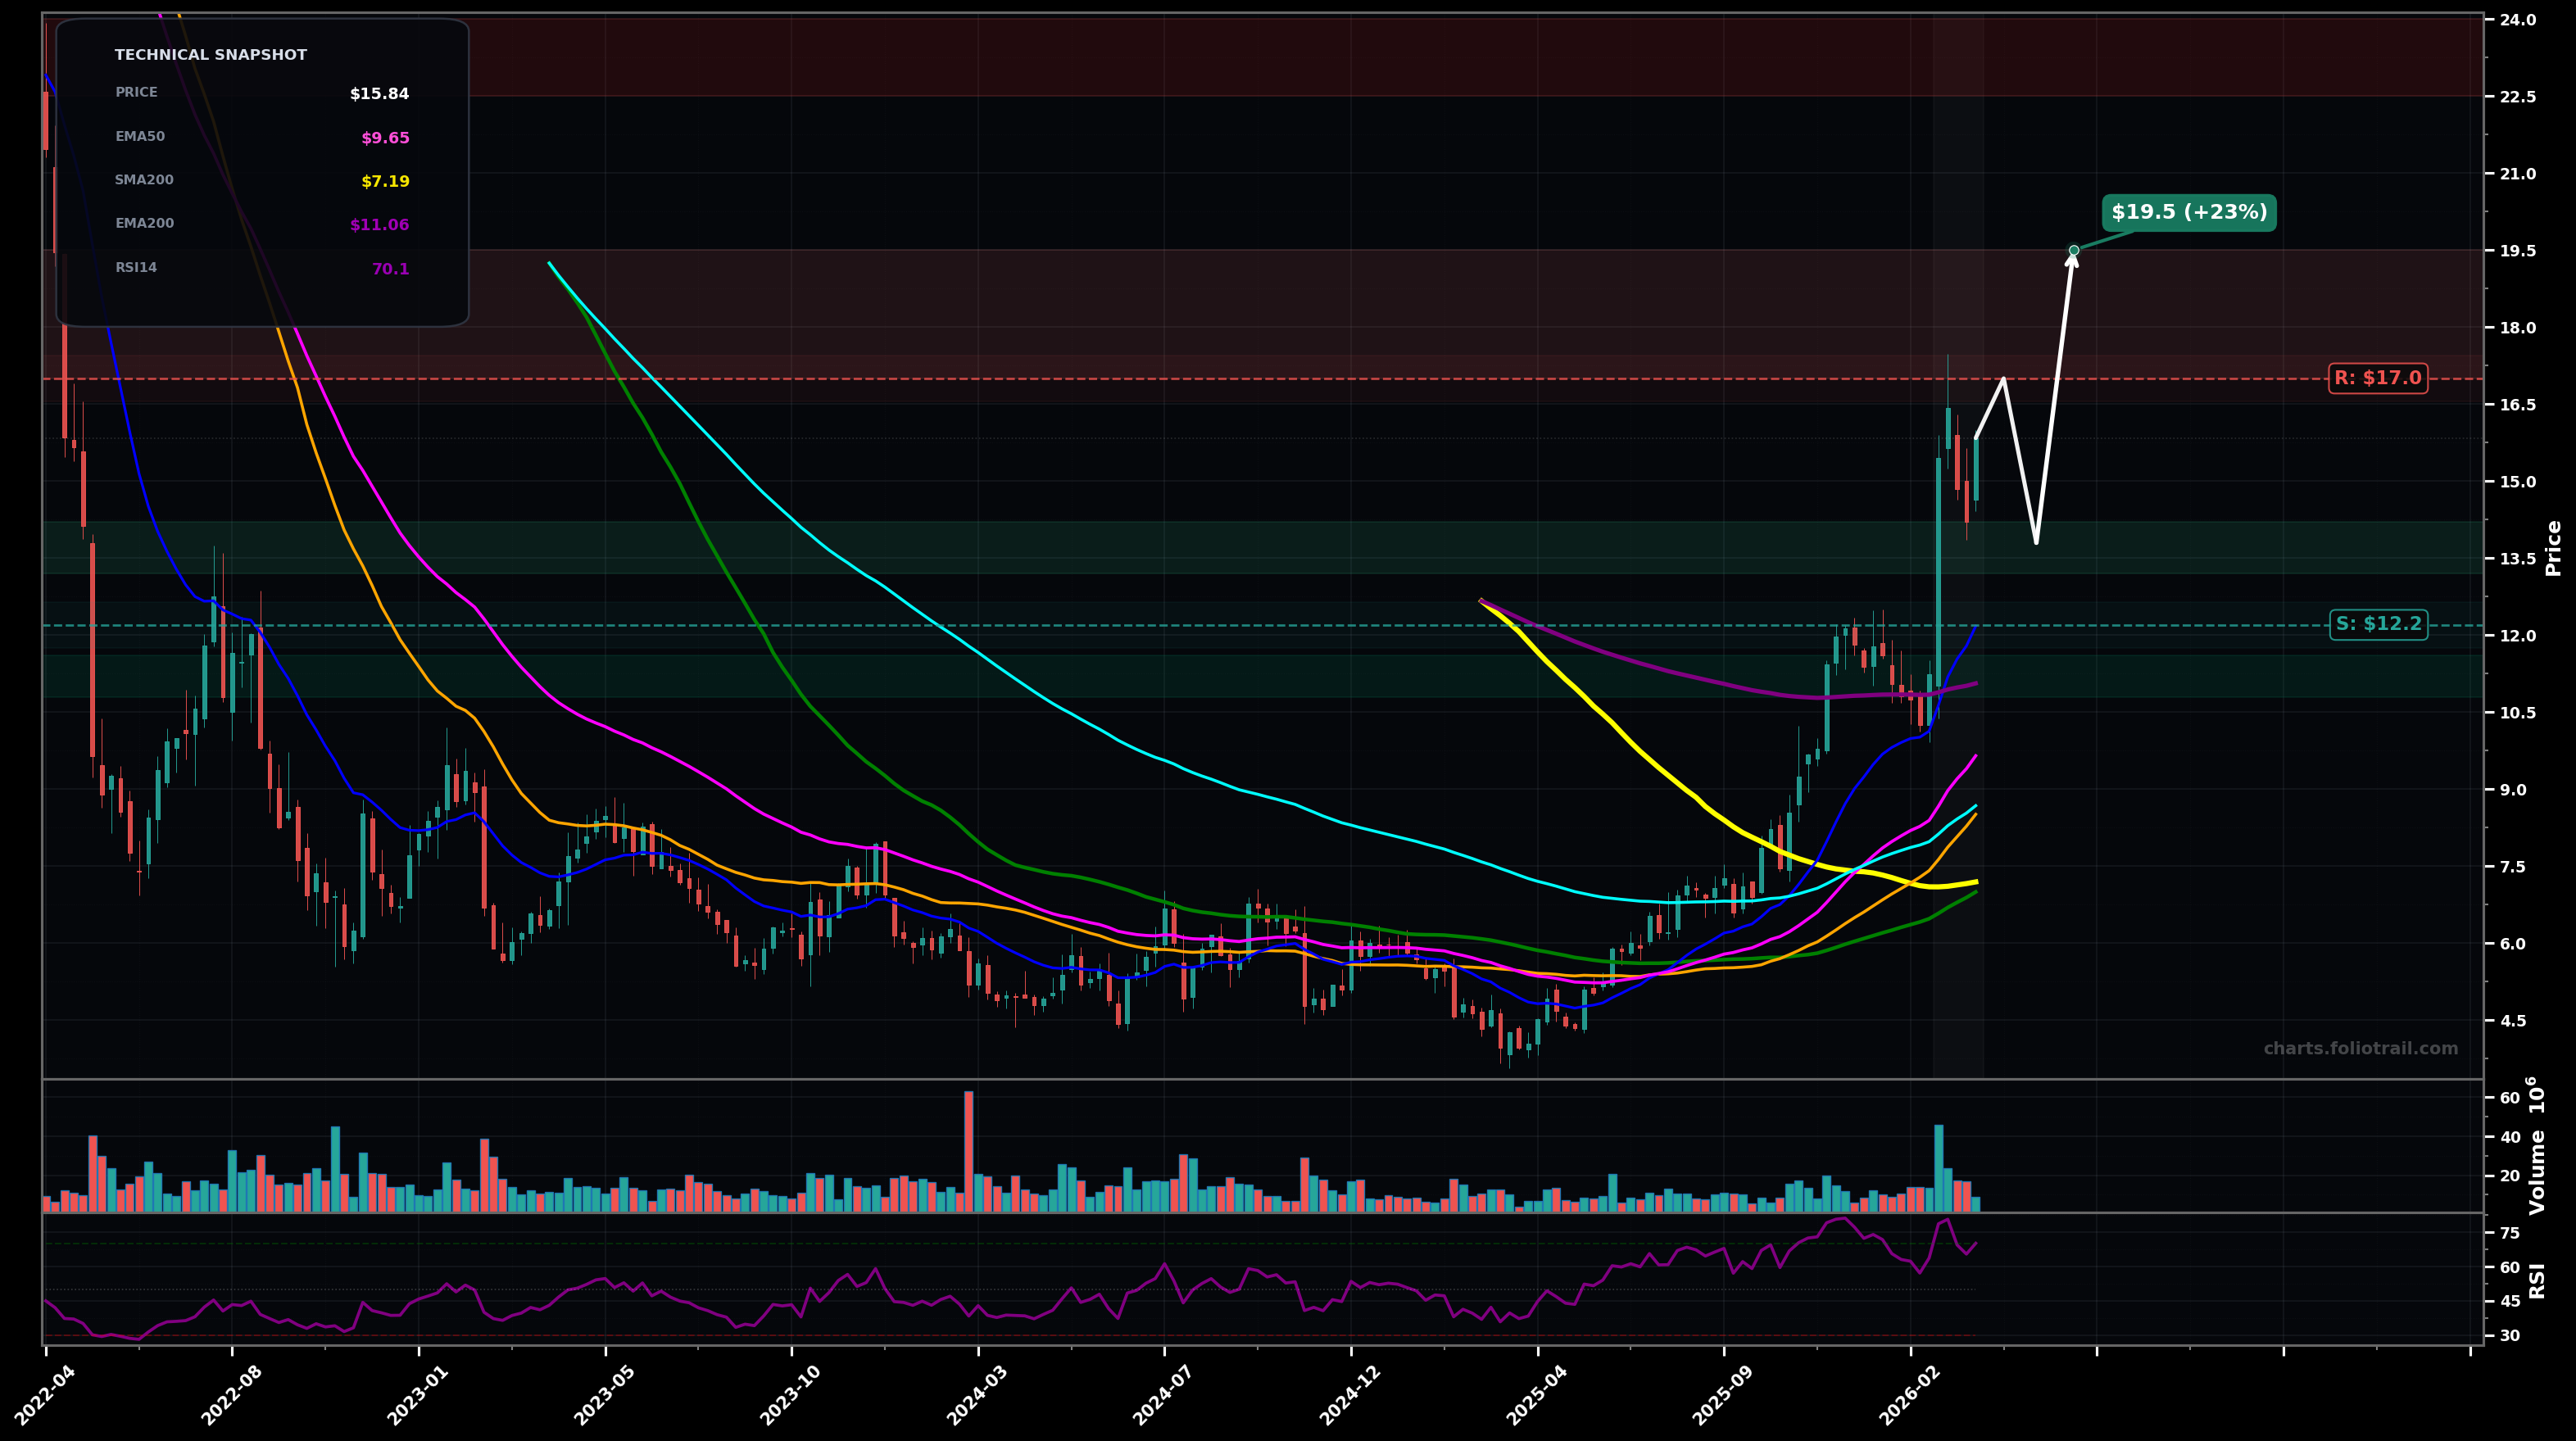
As of March 26, 2026, FIGS (Figs Inc.) is in a parabolic state on the weekly chart, with a confidence level of 68%. Key support is at $12.2 and key resistance at $17.0. Strong weekly breakout and gap-like thrust to ~$17+, followed by a pullback/consolidation around ~$15–$16 while holding above key rising averages; RSI elevated (~70).
Bullish continuation after a shallow consolidation: price holds above the ~$12–$13 breakout/EMA cluster, then retests and breaks $17, extending to the next measured-move/Fib zone.
Deeper mean reversion: post-spike distribution pulls back toward the reclaimed long-term level (EMA200 area), then attempts a higher low and bounce; failure risks a larger retrace toward the prior base.
Weekly close above $17.00 (and hold for 2 closes) would confirm parabolic continuation
Weekly close below $12.20 (loss of the breakout/EMA20 area) would invalidate and shift to a deeper mean-reversion/base scenario
Buy-the-dip zones align with breakout retest and rising EMA20/EMA50 area first, then the more critical reclaim level near EMA200 (~$11) as last-defense support.
Trim into extension: prior spike high/overbought momentum near $17–$19.5, then likely Fib-extension/psych levels $20+ where upside becomes increasingly stretched versus the MA structure.
As of March 26, 2026, FIGS (Figs Inc.) is in a parabolic state on the weekly chart with 68% confidence. Strong weekly breakout and gap-like thrust to ~$17+, followed by a pullback/consolidation around ~$15–$16 while holding above key rising averages; RSI elevated (~70).
On the weekly timeframe, FIGS has key support at $12.2 and key resistance at $17.0. The most likely scenario (bullish) targets $17.0 and $19.5, with a revert level at $13.8.
FIGS (Figs Inc.) is currently classified as parabolic on the weekly chart, with 68% confidence. Confirmation requires: Weekly close above $17.00 (and hold for 2 closes) would confirm parabolic continuation This would be invalidated by: Weekly close below $12.20 (loss of the breakout/EMA20 area) would invalidate and shift to a deeper mean-reversion/base scenario
The most likely scenario (bullish) targets $17.0 and $19.5, with a revert level at $13.8. The alternative scenario (bearish) targets $12.2 and $11.1.
Multi-layer AI agents analyse 200+ stocks across daily, weekly, and monthly timeframes — producing market state classifications, price scenarios with targets, and position entry/exit levels. Updated every trading day after market close. No paywall. No sign-up required.
Built by Foliotrail.
All content on this website — including charts, analysis, price targets, support/resistance levels, and position zones — is generated entirely by AI and provided for educational and informational purposes only.
This is not financial advice. NEXUSNOIR VENTURES SL (the operator of this website) is not a registered investment adviser or broker-dealer. You should not make investment decisions based solely on this information. Always do your own research and consult a qualified financial advisor.
By continuing, you acknowledge that you have read and agree to our full disclaimer & terms of use and privacy policy.