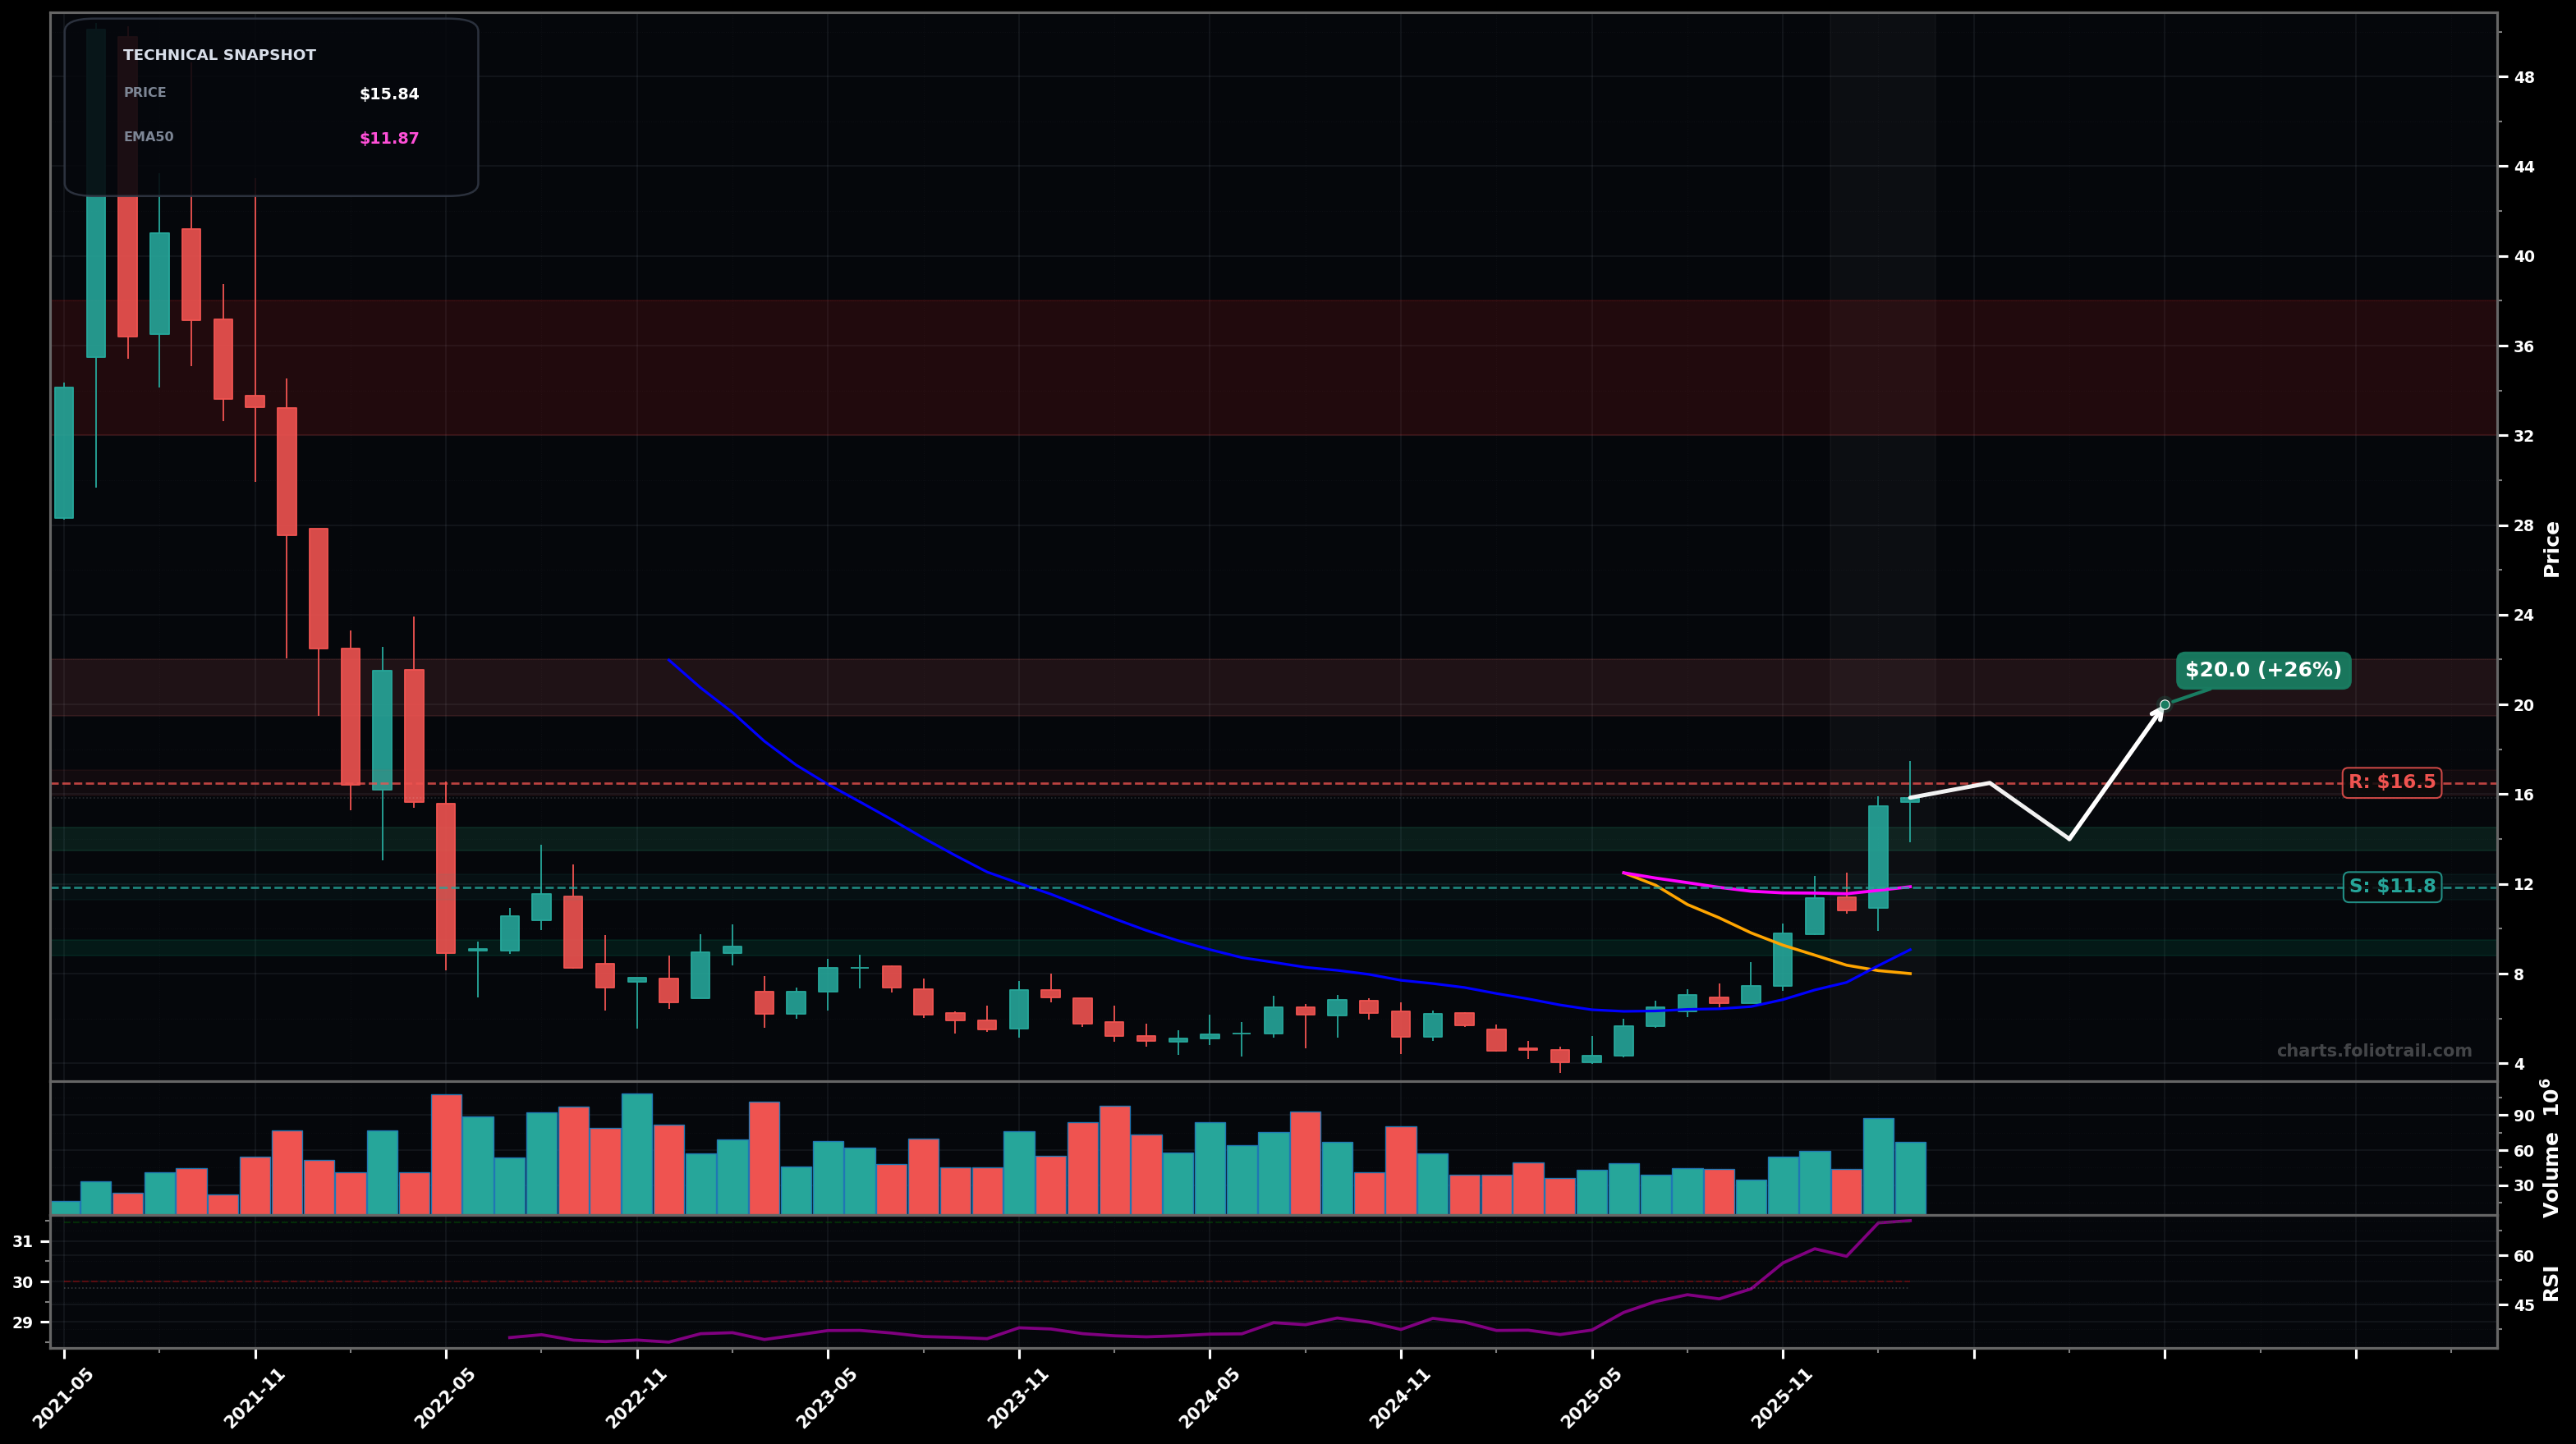
As of March 26, 2026, FIGS (Figs Inc.) is in a volatility expansion state on the monthly chart, with a confidence level of 72%. Key support is at $11.8 and key resistance at $16.5. Monthly breakout from a long base: strong green candles with rising volume; price is above the key short/medium MAs and pushing into prior breakdown supply.
Bullish continuation: price digests briefly above the breakout area, then extends higher as prior supply clears; momentum remains strong while holding above EMA50/20.
Bearish pullback/retest: a post-breakout retrace tests the breakout shelf and fast MAs (EMA50/EMA20 area); if buyers fail to defend, price falls back into the base.
Monthly close holding above $15.00 with follow-through to a new swing high above $16.50
Monthly close back below $11.85 (EMA50 pink) would negate the clean breakout structure
Start on a controlled pullback toward the breakout shelf; add on EMA50 (pink) retest; heavy add only if a deeper mean-reversion returns to the prior base/MA cluster support.
Trim into fib-extension/round-number supply after a volatility expansion; increase trimming if price gets far above EMA50/EMA100; close into a blow-off move approaching major historical supply zones.
As of March 26, 2026, FIGS (Figs Inc.) is in a volatility expansion state on the monthly chart with 72% confidence. Monthly breakout from a long base: strong green candles with rising volume; price is above the key short/medium MAs and pushing into prior breakdown supply.
On the monthly timeframe, FIGS has key support at $11.8 and key resistance at $16.5. The most likely scenario (bullish) targets $16.5 and $20.0, with a revert level at $14.0.
FIGS (Figs Inc.) is currently classified as volatility expansion on the monthly chart, with 72% confidence. Confirmation requires: Monthly close holding above $15.00 with follow-through to a new swing high above $16.50 This would be invalidated by: Monthly close back below $11.85 (EMA50 pink) would negate the clean breakout structure
The most likely scenario (bullish) targets $16.5 and $20.0, with a revert level at $14.0. The alternative scenario (bearish) targets $12.0 and $9.00.
Multi-layer AI agents analyse 200+ stocks across daily, weekly, and monthly timeframes — producing market state classifications, price scenarios with targets, and position entry/exit levels. Updated every trading day after market close. No paywall. No sign-up required.
Built by Foliotrail.
All content on this website — including charts, analysis, price targets, support/resistance levels, and position zones — is generated entirely by AI and provided for educational and informational purposes only.
This is not financial advice. NEXUSNOIR VENTURES SL (the operator of this website) is not a registered investment adviser or broker-dealer. You should not make investment decisions based solely on this information. Always do your own research and consult a qualified financial advisor.
By continuing, you acknowledge that you have read and agree to our full disclaimer & terms of use and privacy policy.