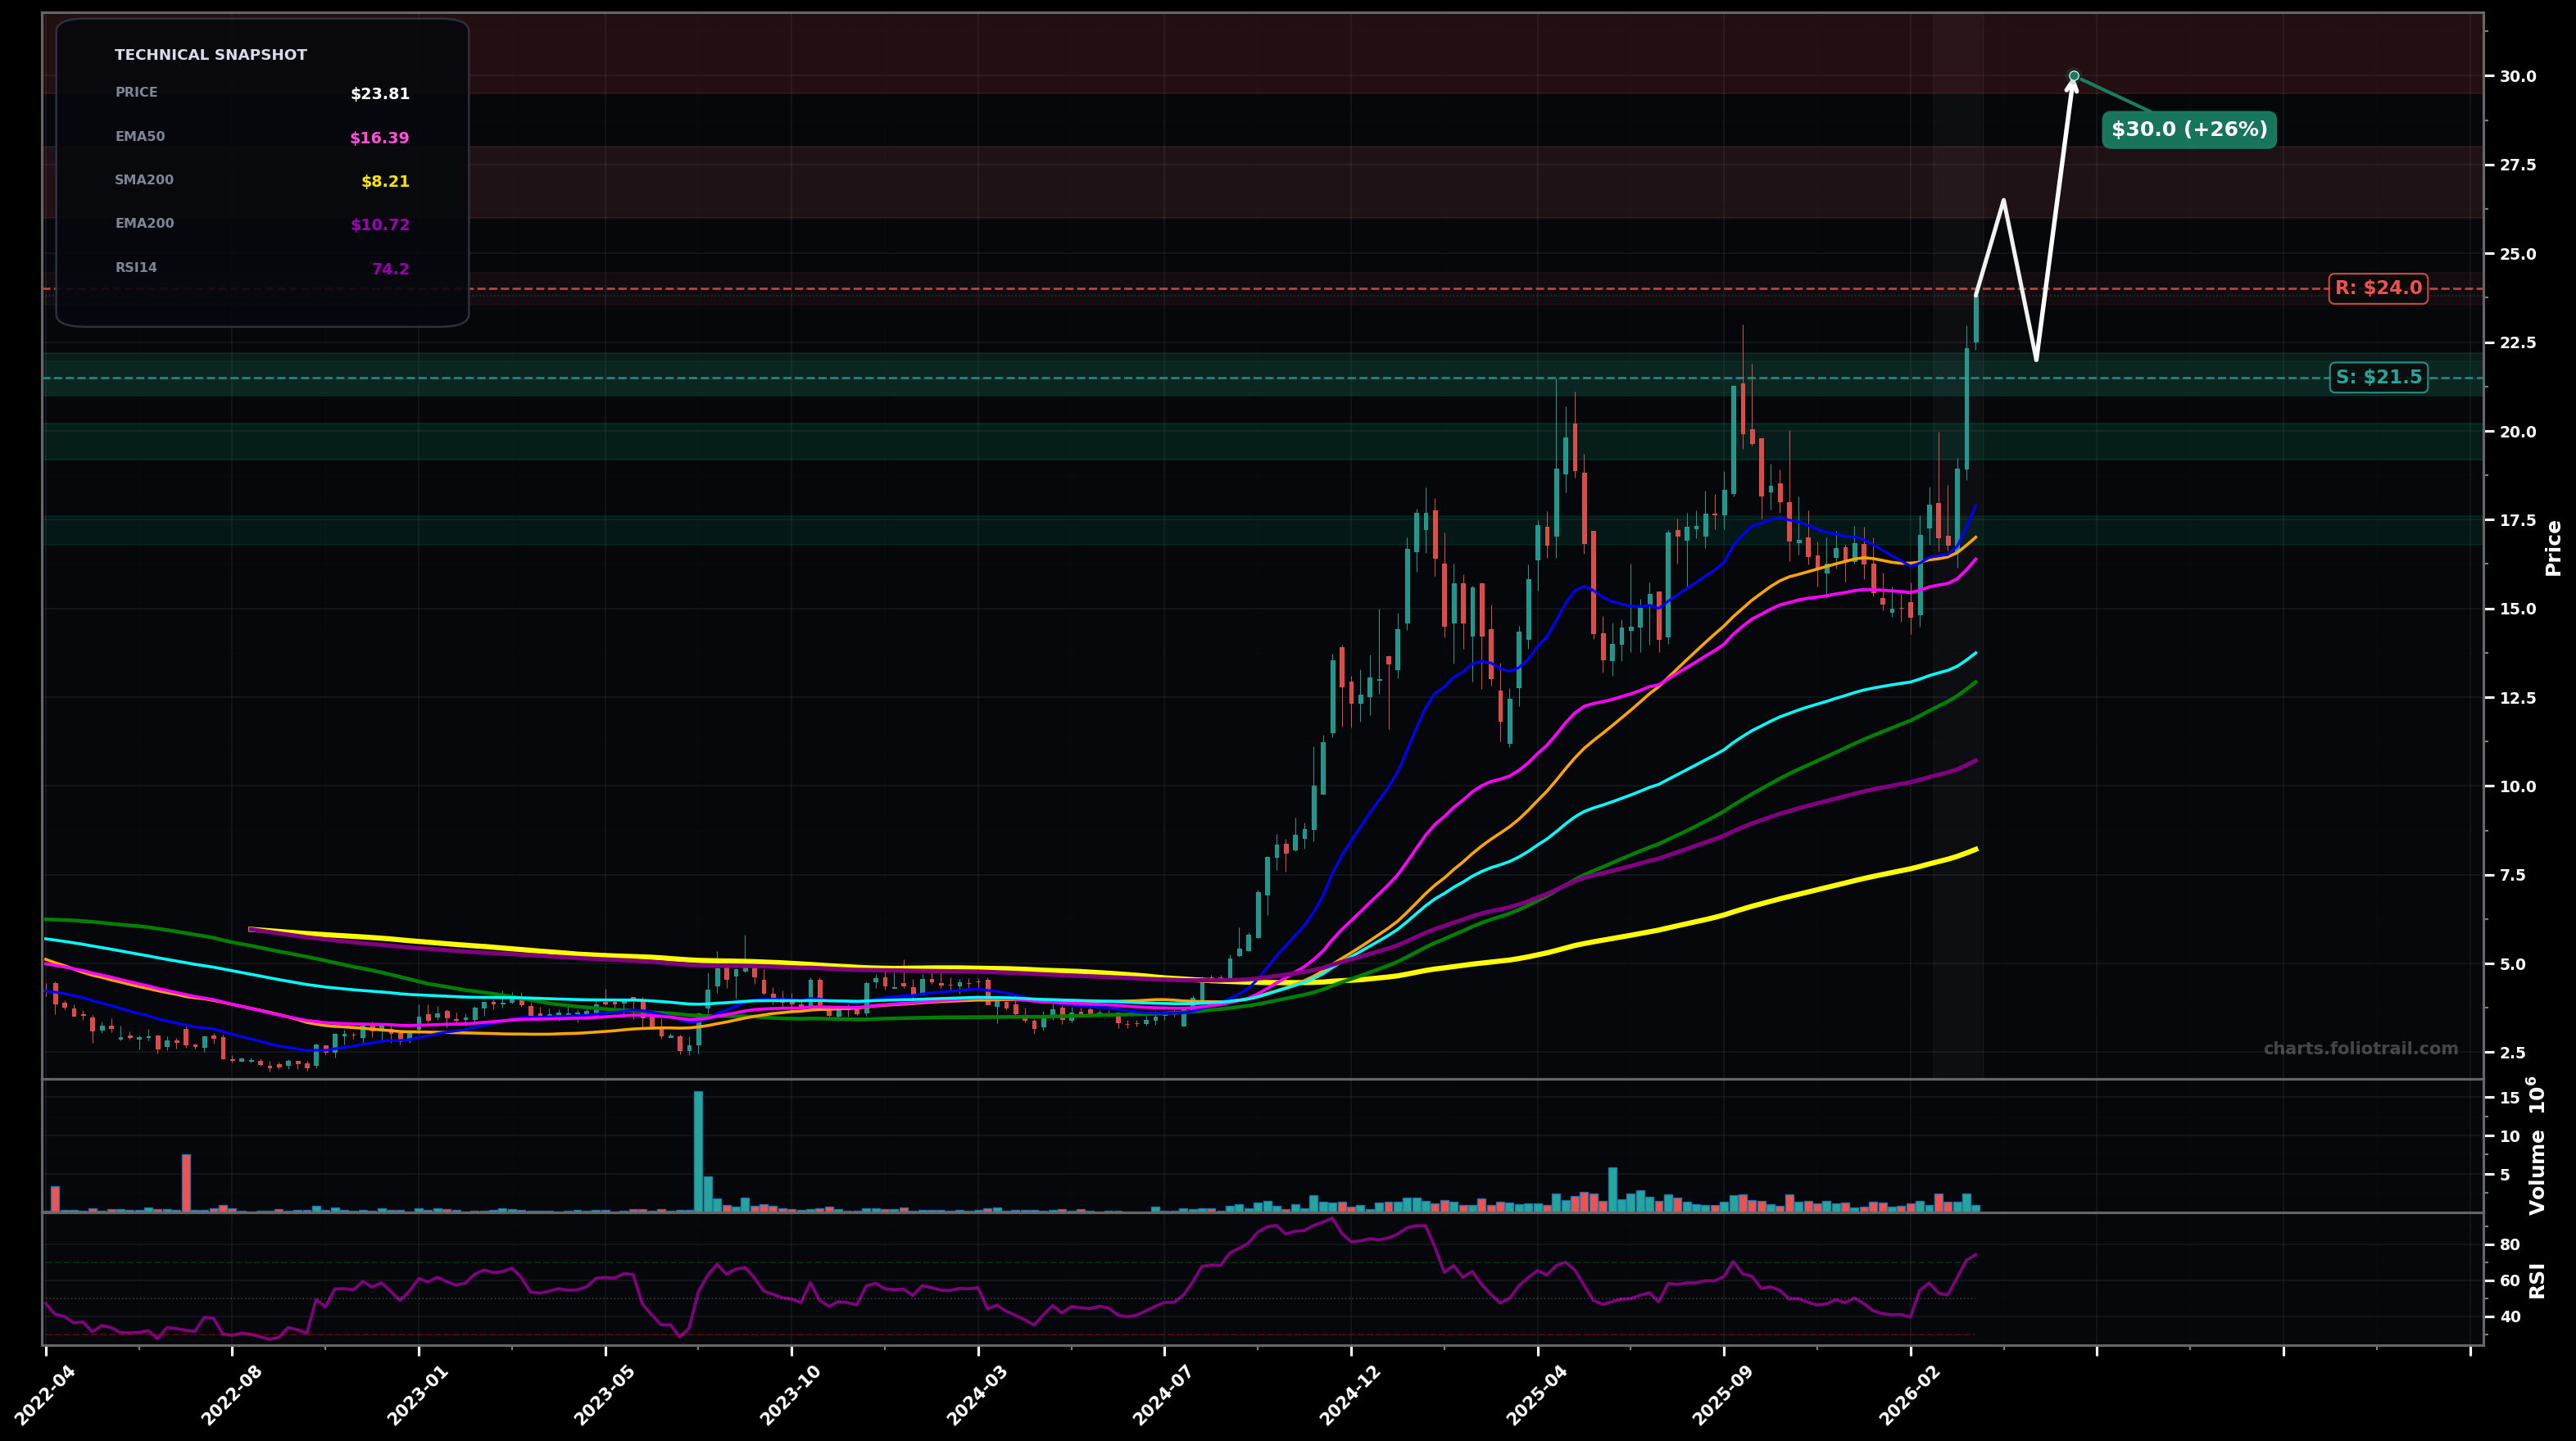
As of March 24, 2026, ETON (Eton Pharmaceuticals Inc.) is in a uptrend state on the weekly chart, with a confidence level of 74%. Key support is at $21.5 and key resistance at $24.0. Weekly breakout to new cycle highs with a strong green expansion candle; price extended above rising short/mid MAs and RSI elevated.
Bullish continuation: breakout holds, brief consolidation/pullback is bought, then trend resumes toward Fibonacci extensions (measured from the ~$15.50–$16 base to ~$24 breakout). Rough probability: 60%. Elliott-wave read: likely in Wave 5 extension or Wave 3 of a higher-degree advance; expect sharp but brief pullbacks.
Bearish shakeout: failed breakout with a momentum unwind (RSI >70) back into the prior range, testing the rising EMA50/SMA50 zone before buyers reappear. Rough probability: 40%. Elliott-wave alt: current spike was a late Wave 5 blow-off, entering an A-B-C correction toward the prior Wave 4 area.
Hold $21.50+ on weekly closes (prior breakout area) for 2 consecutive weeks
Weekly close below $18.00 (loss of prior base/MA cluster support)
Start near breakout retest ($21-22); add on pullback into prior range/EMA50 area (~$19-20); heavy add near deeper Fib retrace + prior pivot/MA shelf (~$17).
Trim into Fib extension zones above the breakout where RSI tends to get stretched; larger trims into major extension/round-number supply and prior measured-move projections.
As of March 24, 2026, ETON (Eton Pharmaceuticals Inc.) is in a uptrend state on the weekly chart with 74% confidence. Weekly breakout to new cycle highs with a strong green expansion candle; price extended above rising short/mid MAs and RSI elevated.
On the weekly timeframe, ETON has key support at $21.5 and key resistance at $24.0. The most likely scenario (bullish) targets $26.5 and $30.0, with a revert level at $22.0.
ETON (Eton Pharmaceuticals Inc.) is currently classified as uptrend on the weekly chart, with 74% confidence. Confirmation requires: Hold $21.50+ on weekly closes (prior breakout area) for 2 consecutive weeks This would be invalidated by: Weekly close below $18.00 (loss of prior base/MA cluster support)
The most likely scenario (bullish) targets $26.5 and $30.0, with a revert level at $22.0. The alternative scenario (bearish) targets $19.5 and $17.0.
All content on this website — including charts, analysis, price targets, support/resistance levels, and position zones — is generated entirely by AI and provided for educational and informational purposes only.
This is not financial advice. NEXUSNOIR VENTURES SL (the operator of this website) is not a registered investment adviser or broker-dealer. You should not make investment decisions based solely on this information. Always do your own research and consult a qualified financial advisor.
By continuing, you acknowledge that you have read and agree to our full disclaimer & terms of use and privacy policy.