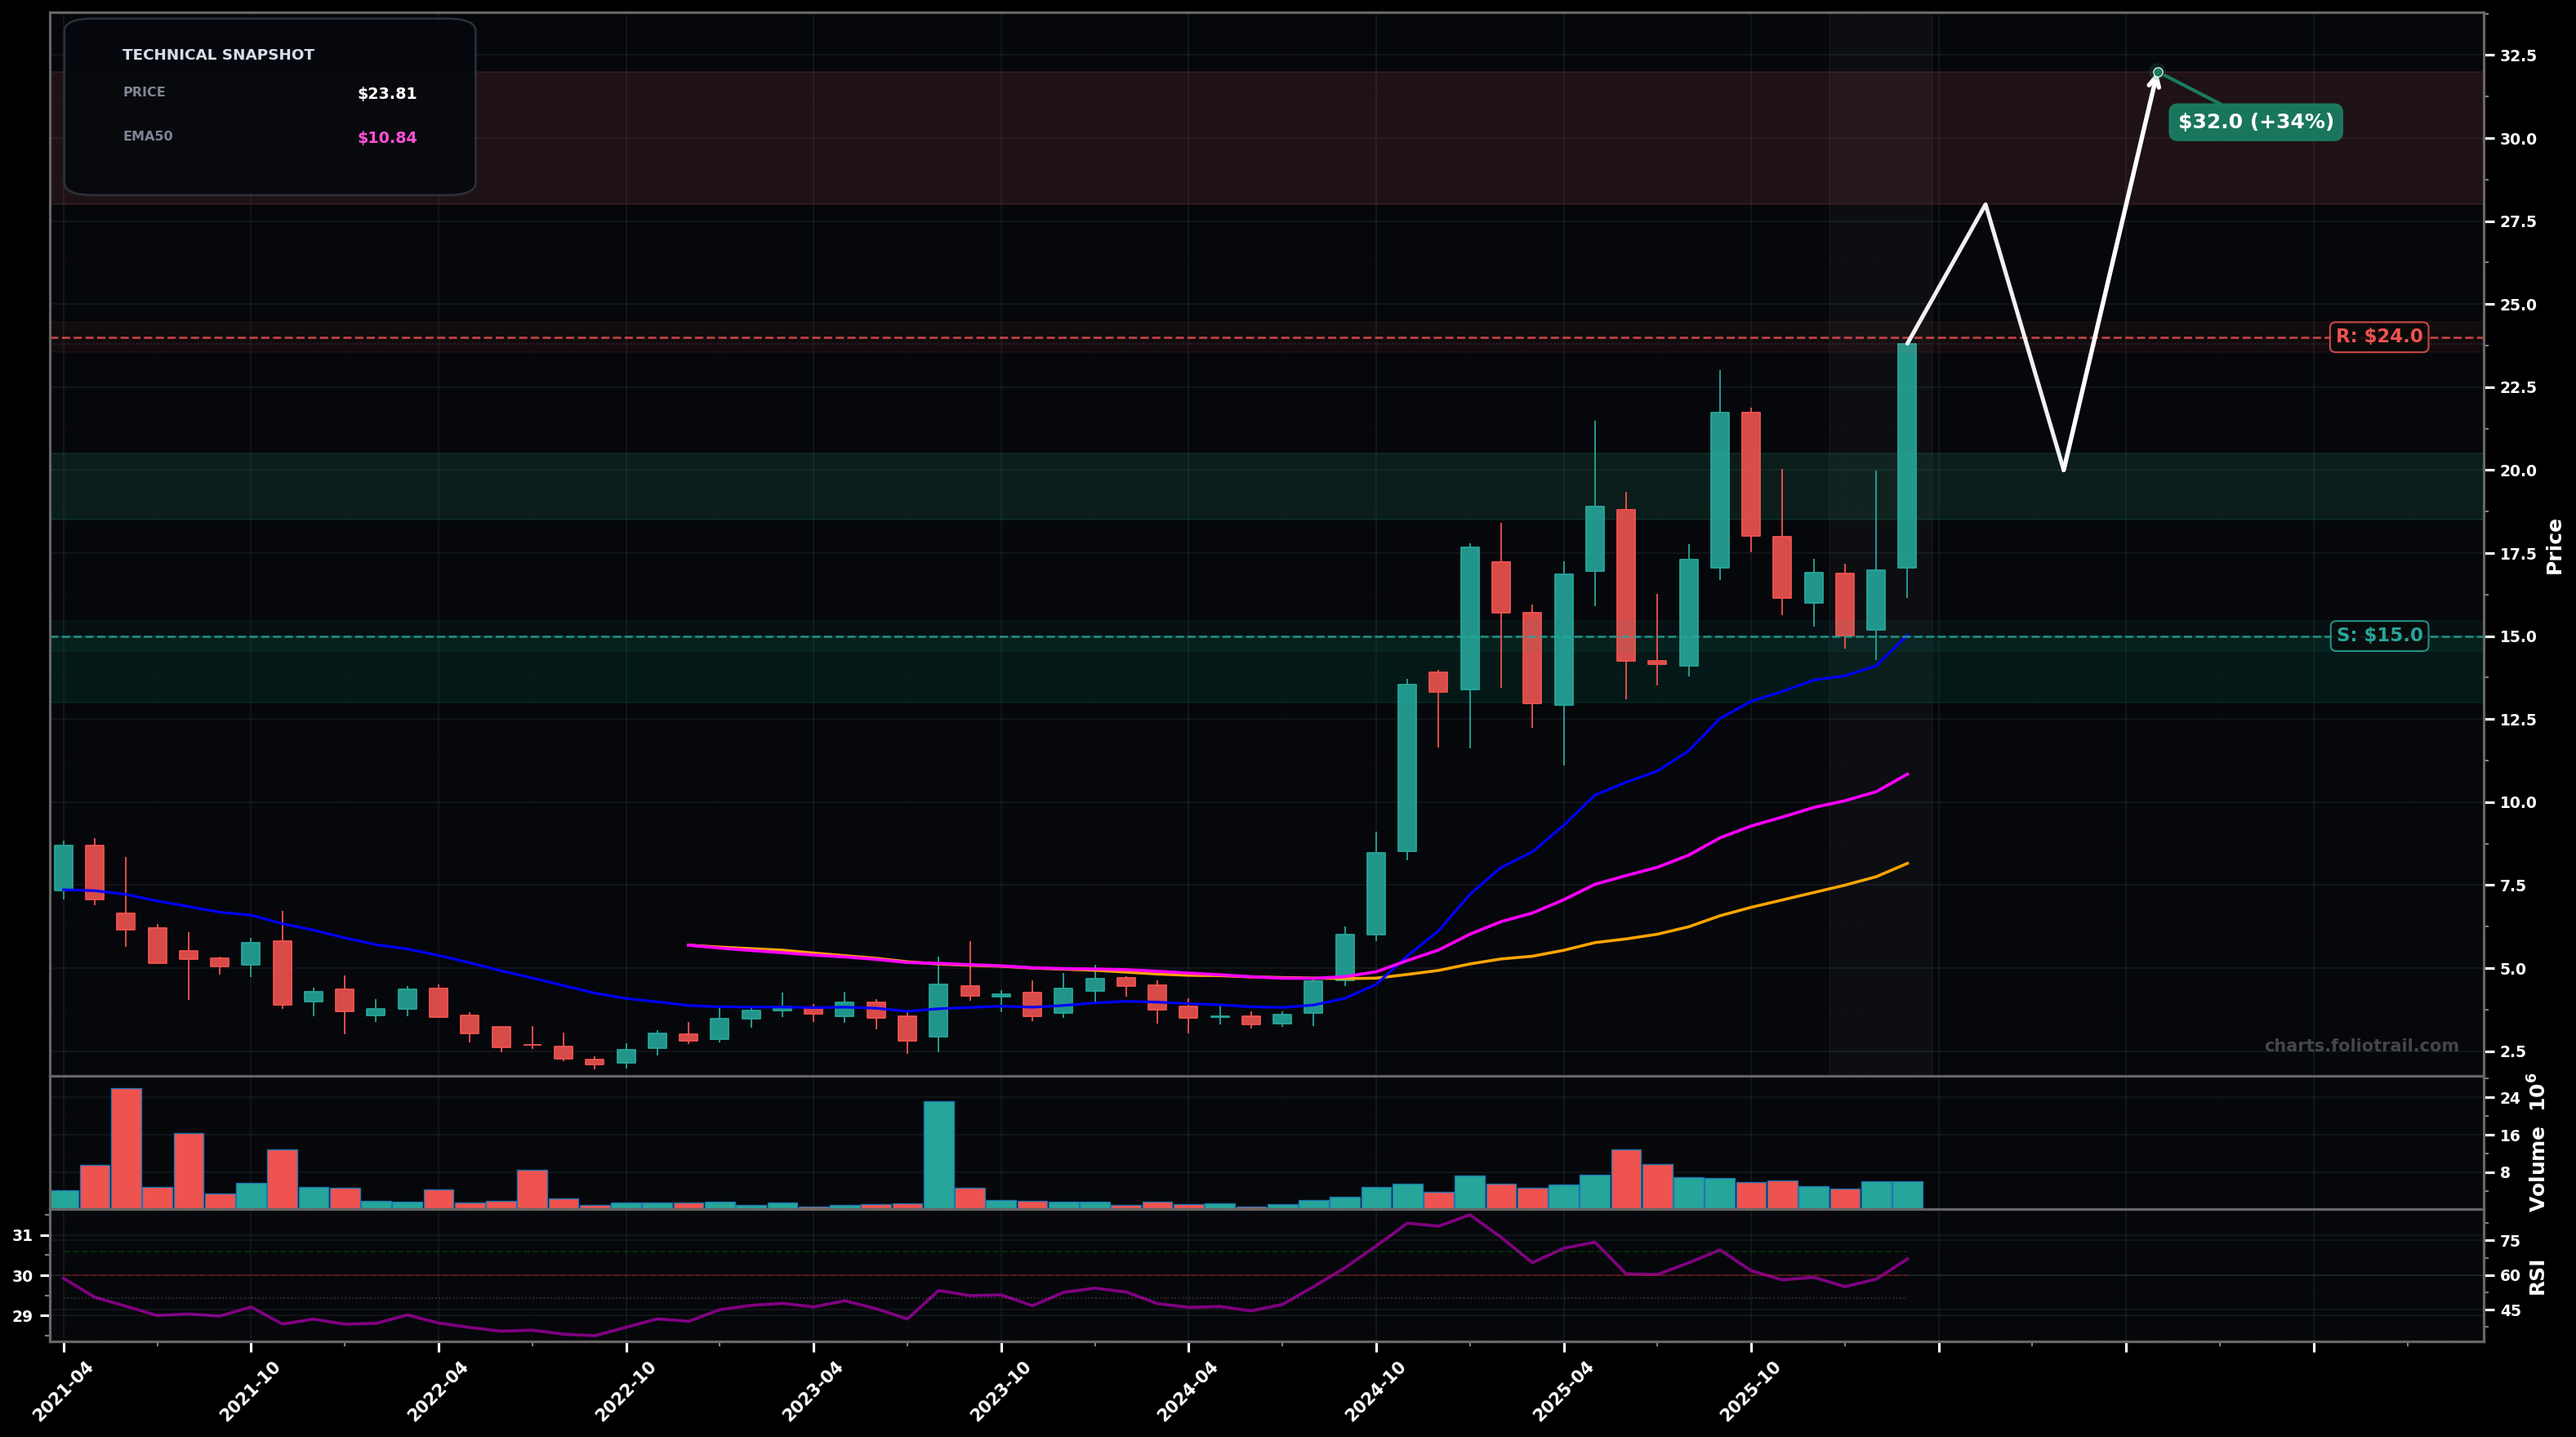
As of March 24, 2026, ETON (Eton Pharmaceuticals Inc.) is in a uptrend state on the monthly chart, with a confidence level of 74%. Key support is at $15.0 and key resistance at $24.0. Monthly momentum breakout to a new swing high near $24 with price extended above rising EMA50/EMA20; RSI ~67 (strong but not extreme).
Bullish continuation: price consolidates above the prior breakout zone ($18-$20), then pushes to the next Fibonacci extensions; Elliott Wave read: likely in a Wave 3/5 advance with brief Wave 4-type pullback risk.
Deeper pullback/retest: a Wave 4 correction unfolds (ABC), fading the spike and revisiting the rising EMA50 area before trend continuation; if $15 breaks, structure shifts toward a larger correction.
2 monthly closes holding above $24.00
Monthly close below $15.00
Buy tranches around prior breakout/supply flip ($18-$20), then EMA50/structure support ($16-$18), then last-ditch swing support and trend invalidation buffer ($13-$15).
Trim into upside extensions after a vertical run (likely late Wave 3/5 behavior) where distance from EMA50 becomes stretched and mean-reversion risk rises.
As of March 24, 2026, ETON (Eton Pharmaceuticals Inc.) is in a uptrend state on the monthly chart with 74% confidence. Monthly momentum breakout to a new swing high near $24 with price extended above rising EMA50/EMA20; RSI ~67 (strong but not extreme).
On the monthly timeframe, ETON has key support at $15.0 and key resistance at $24.0. The most likely scenario (bullish) targets $28.0 and $32.0, with a revert level at $20.0.
ETON (Eton Pharmaceuticals Inc.) is currently classified as uptrend on the monthly chart, with 74% confidence. Confirmation requires: 2 monthly closes holding above $24.00 This would be invalidated by: Monthly close below $15.00
The most likely scenario (bullish) targets $28.0 and $32.0, with a revert level at $20.0. The alternative scenario (bearish) targets $16.5 and $13.5.
All content on this website — including charts, analysis, price targets, support/resistance levels, and position zones — is generated entirely by AI and provided for educational and informational purposes only.
This is not financial advice. NEXUSNOIR VENTURES SL (the operator of this website) is not a registered investment adviser or broker-dealer. You should not make investment decisions based solely on this information. Always do your own research and consult a qualified financial advisor.
By continuing, you acknowledge that you have read and agree to our full disclaimer & terms of use and privacy policy.